Entry-Level Frenzy
This is as far east as you can get in Oceanside, so it’s not really much a coastal home when it’s 4-5 miles away. But this is a great example of what is happening at the entry level of every market today!

This is as far east as you can get in Oceanside, so it’s not really much a coastal home when it’s 4-5 miles away. But this is a great example of what is happening at the entry level of every market today!
San Diego Case-Shiller Index, Non-Seasonally Adjusted
| Month | |||
| Jan 22 | |||
| Feb | |||
| Mar | |||
| Apr | |||
| May | |||
| Jun | |||
| Jul | |||
| Aug | |||
| Sep | |||
| Oct | |||
| Nov | |||
| Dec | |||
| Jan 23 | |||
| Feb | |||
| Mar | |||
| Apr | |||
| May | |||
| Jun | |||
| Jul | |||
| Aug | |||
| Sep | |||
| Oct | |||
| Nov | |||
| Dec | |||
| Jan 24 |
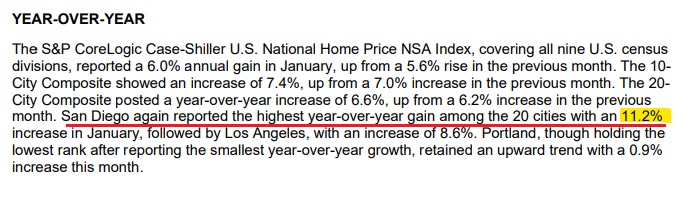
It has felt like prices have been surging this year, and here is more evidence. The record high was 427.80 in May, 2022, and it should be back to that level by the next reading.
We’re in the midst of all-time record-high pricing today!
My only thought when seeing thas property was whether Kellen Winslow Jr would affect the outcome or if whether we are beyond that now. He bought his new for $2,871,000 in 2015 and had to cheap sell it for $2,850,000 in 2019 when he got into trouble.
But even his house resold for $4,800,000 last year, so no lingering after effects, apparently.
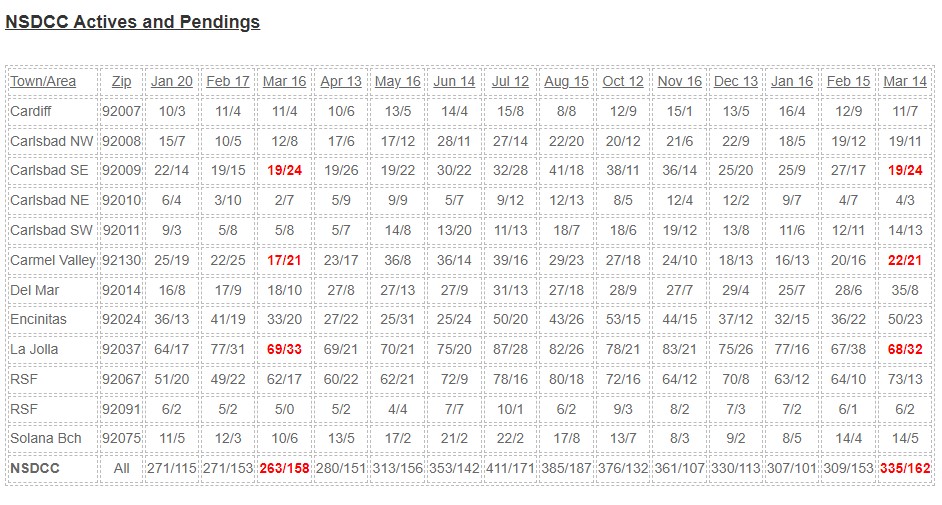
There are 27% more active listings today than there were last March – without much increase in the number of pendings – though the areas in red above are just as hot as they were last year at this time.
Judging by the number of active (unsold) listings compared to the totals though, sales are more sluggish now than in any year since 2019 when we had 90 actives priced under $1 million (today there are none):
NSDCC Total Listings Jan 1 to Mar 10 and Active Listings in Mid-March
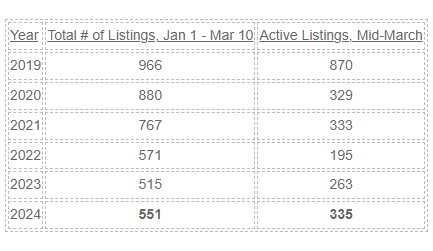
Last year, we didn’t have 335 actives until the end of May!
Sellers will call it normalizing, and buyers will wonder how much more normal will it get!
It’s doubtful that today’s buyers are remembering 2019 though, and if anything they are comparing to last year – and looking for any reason not to buy. If the active count keeps rising, it’s going to look like a glut in a couple of months.
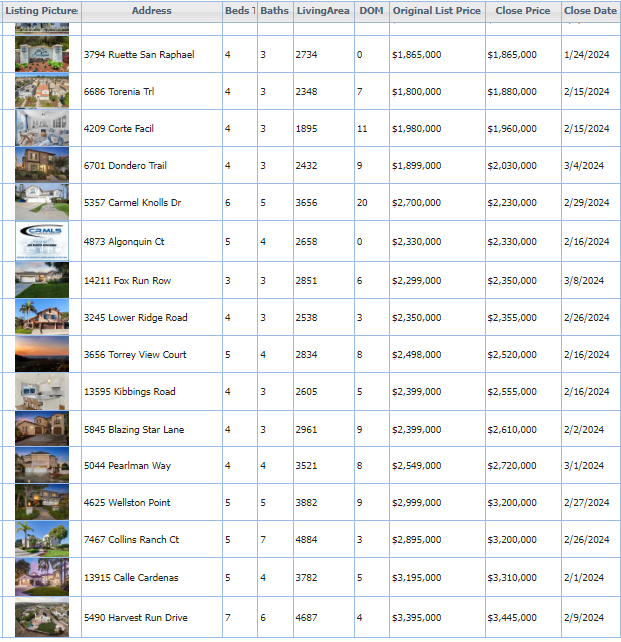
Above are the 2024 listings that have already closed escrow in Carmel Valley – it’s very competitive.
We’re heading into a new era where buyer-agents will be appreciated less than ever, if at all.
Consider this – in a bidding war where the sellers listing agent will be choosing between similar offers, won’t having a solid, reputable buyer’s agent on your side be helpful?
Not only will the buyer get strategic advice on making a more-lucrative offer, but the buyer-agent’s reputation will also play a role in the outcome. The listing agent will want to select a deal that has the best chance of closing easily, and their comfort and familarity with the buyer-agent will make a difference here in a tight race!
Happy March!
These are updated on the first of the month and are interactive:
No real concerns there. The low volume causes the bumpy appearance, but for the most part, the pricing is fairly steady. If there were a downward trend for a few months, it would be different.
This month’s housing stats will benefit from an extra business day due to the leap year, but it will just be icing on the cake. The sales this month have already blown by last February, in spite of higher pricing.
I think we can say that we’re back to frenzy-like conditions:
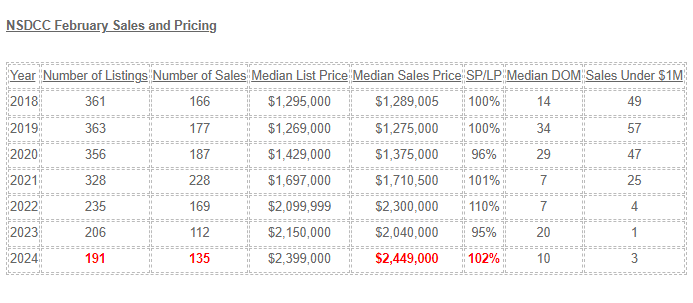
Some agents insist on inputting their listings of attached homes in the SFR category. There has only been ONE house sale under $1,000,000 in the last three Februarys.
This month’s total will probably be around 160-170 sales, which is phenomenal when you consider that we had similar monthly sales counts when pricing was half of what it is today! Not only that, but the number of sales will be close to the total number of listings too – probably closer than during the peak frenzy years.
With declining sales across the country, there are complaints about how bad the market has been, and people are wondering when it will get ‘better’. Better? This is great, relatively, and this is what we’re going to have for the next few years because the boomers are still relatively young (half are still working).
It will take a surge of new listings, and/or a drop in demand, which you’d think would happen naturally as prices go higher. But not yet.
How’s the flow of new listings?
After a hot January that was +18% YoY, the February listings have cooled off – though there will be late-reporters that should get this year’s count up to 220-ish:
NSDCC Monthly Listings
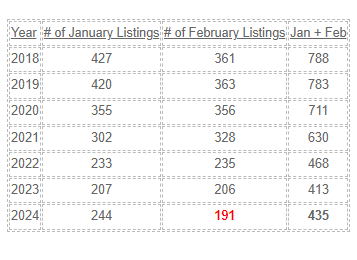
Two months into the new year, I think we have found our groove. The inventory will stay low, and the special homes will keep blowing off the market – with the rest having to find their way.
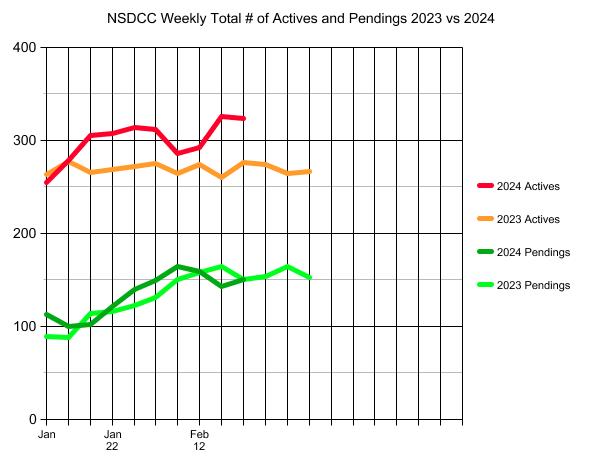
This year’s inventory is looking a lot like last year, with a few more listings hanging around unsold.
NSDCC Total Number of Listings, Jan 1 through Feb 20
2023: 355
2024: 395
How’s the pricing? Here are the weekly quartiles for 2023 and 2024:
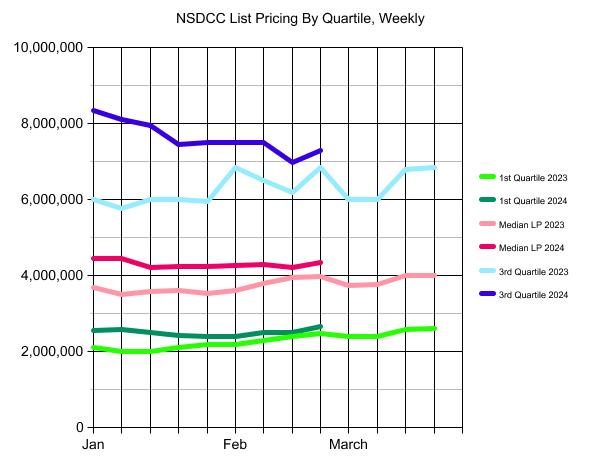
It looks like the market is settling in for a ride that’s similar to the one we had in 2023!
Another good way to anticipate the market trends is to check the direction of the SP:LP ratio:
NSDCC Monthly Sales and SP:LP Ratio
| Month | ||||
| Jan 2022 | ||||
| Feb | ||||
| Mar | ||||
| Apr | ||||
| May | ||||
| Jun | ||||
| Jul | ||||
| Aug | ||||
| Sep | ||||
| Oct | ||||
| Nov | ||||
| Dec | ||||
| Jan 2023 | ||||
| Feb | ||||
| Mar | ||||
| Apr | ||||
| May | ||||
| Jun | ||||
| Jul | ||||
| Aug | ||||
| Sep | ||||
| Oct | ||||
| Nov | ||||
| Dec | ||||
| Jan 2024 | ||||
| Feb |
Pricing looks strong – similar to the March-May, 2022 era, which was the hottest frenzy ever!
The comment section here isn’t working – it’s been weeks now!!
I have decent people helping me so we’ll keep trying.
In the meantime, check the competition from the big-time corporate owners of real estate and how they go about selling homes:


Are you looking for an experienced agent to help you buy or sell a home?
Contact Jim the Realtor!
CA DRE #01527365, CA DRE #00873197
