Estate Sales Online

This idea is ingenious!
Maxsold has a team of staff people in San Diego County to come to your house, photograph all your stuff, and then sell it online for you!
Check out this video:
Get started here:

This idea is ingenious!
Maxsold has a team of staff people in San Diego County to come to your house, photograph all your stuff, and then sell it online for you!
Check out this video:
Get started here:
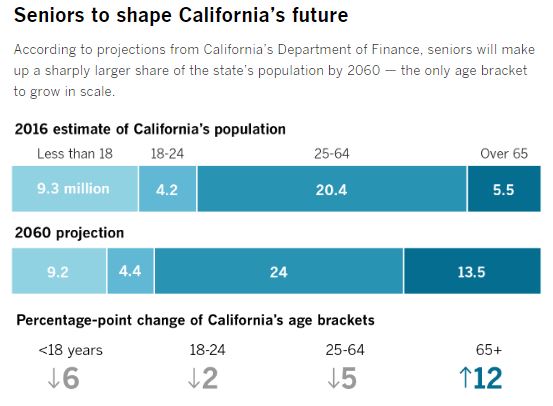
In the last post we saw how expensive kids can be, and taking care of the growing number of seniors is another strain on the Bank of Mom and Dad. Thanks daytrip for sending this in from the latimes.com – an excerpt:
“We are exquisitely unprepared for that [oldest] age demographic pushing through,” said Dr. Bruce Chernof, president of the SCAN Foundation, an aging advocacy group.
By many measures, California is not ready to meet the demand for long-term care. Just under 2% of residents are insured for it, according to the state Department of Insurance.
A 2014 poll found that just 3 in 10 Californians over age 40 felt very confident about their ability to pay for future care. And the Employment Development Department projects that the state will need 250,000 more personal care aides by 2026, a growth rate of 40%.
Nancy McPherson, the California state director for AARP, said long-term care is the No. 1 issue for the retiree advocacy group.
“It’s not enough to have service delivery,” McPherson said. “You need to have a coordinated system, and you need to have a means for middle-income Californians to get the support they need.”
Though wealthy Californians can rely on long-term care insurance or ample savings and the poorest can qualify for safety-net programs, the middle class is especially vulnerable when it comes to paying for care.
The out-of-pocket costs can be staggering, and Medicare, the federal healthcare program for seniors, does not cover long-term care. A 2017 survey by Genworth, a long-term insurance company, found the average yearly cost for a home healthcare aide was $57,200. The median cost for a private room in a nursing home was more than $116,000.
“You are depleting generational wealth, ensuring it is not passed down,” said Kristina Bas Hamilton, legislative director of United Domestic Workers, a union of home care providers. “You are essentially demolishing the American dream of the kids doing better than the parents.”
Read full article here:
http://www.latimes.com/projects/la-pol-ca-next-california-demographics/

Factor in the cost of raising children into the future housing demand – how much farther can the Bank of Mom and Dad go? Hat tip daytrip:
The average cost of raising a child until age 18 today is more than $230,000— but that number only gets higher when children leave the nest. In fact, many parents consider it to be the most expensive stage of parenting, according to Merrill Lynch’s new “The Financial Journey of Modern Parenting: Joy, Complexity, and Sacrifice”report.
The bank surveyed more than 2,500 American parents and found that 79% of parents continue to provide financial support to their adult children — contributing to an estimated $500 billion annually. That’s twice the amount they save for retirement — $250 billion annually — according to the report. There are 173 million parents in the US, according to Merrill Lynch.
“When emotions and money become intertwined, parents risk making financial decisions that can compromise their financial futures,” states the report.
Seventy-two percent of parents revealed they put their children’s interests ahead of their own need to save for retirement. On top of that, 63% of parents reported sacrificing their own financial security for their children’s sake. Specifically, Asian, Latino, and African American parents are more likely to give up financial security for their children, the report found.
So what exactly are parents paying for? The answer is both big and small, with parents covering necessities, like rent or mortgage, as well as luxuries, like vacations.
Of the $500 billion total amount parents are spending on adult children, college education comprises about one-fourth, according to the report; groceries and food cost $54 billion annually and cell phone service costs $18 billion, with many parents covering the full cost, not just handing over a few dollars.
But that total doesn’t count big-ticket items — about 60% of parents help pay for their adult child’s wedding and 25% help pay for their child’s first home.
Link to Full Article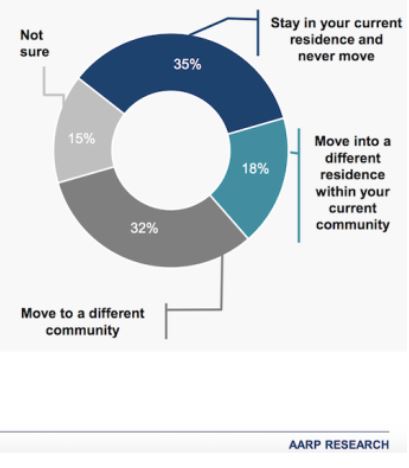
Here’s the interesting excerpt from this article – the other alternatives that older adults might consider:
Communities become a source of support and engagement for residents, particularly for older adults, who have an even stronger desire to age in place. The AARP survey finds many adults age 50 and older are willing to consider alternatives such as home sharing (32%), building an accessory dwelling unit (31%) and villages that provide services that enable aging in place (56%).
Link to ArticleA study released Thursday by Trulia examined the housing situations of homeowners 65 and older and compared it with a decade ago. It uncovered a 3.4% jump in the number of seniors working in 2016 compared with 2005, and a 1.7% increase in the number living with younger generations.
It also showed that seniors appear to be holding off on downsizing just the same as they were 10 years prior.
Only 5.5% of seniors moved, according to Trulia, and of those who did, the split was pretty even between single-family and multifamily residences.
But Trulia analyst Alexandra Lee points out that while the percentage of downsizers hasn’t changed, the number of those moving actually has.
“Because the Boomer generation is so much larger than previous generations, that 5.5% moving rate translates into very different raw numbers across the years,” Lee wrote. “There were about 7 million more senior households in 2016 than 2005, meaning 386,000 more senior households moved in 2016.”
The age at which seniors decide to downsize has also shifted. The survey revealed that in 2005, seniors were moving into multifamily residences by age 75. By 2016, this had moved to 80.
Link to ArticleWill the current turbulence in the real estate market make boomers drop everything and list their home for sale in the coming months, or just scoot a little closer to the exits?
How many were already counting on every dollar of equity based on their lofty estimates of value that are now in question? Do they pack it up and wait for a few more years? Or sell now while they can?
The pressure is coming from many angles too – if it was just up to boomers having to survive on their own, they’d be fine, even if they had to cut back on the current lifestyle. It’s their parents needing the expensive assisted-living and the kids trying to get ahead that puts the additional strain on boomers, and could make them sell their house.
It’s a curious topic for those around housing – how will it all play out?
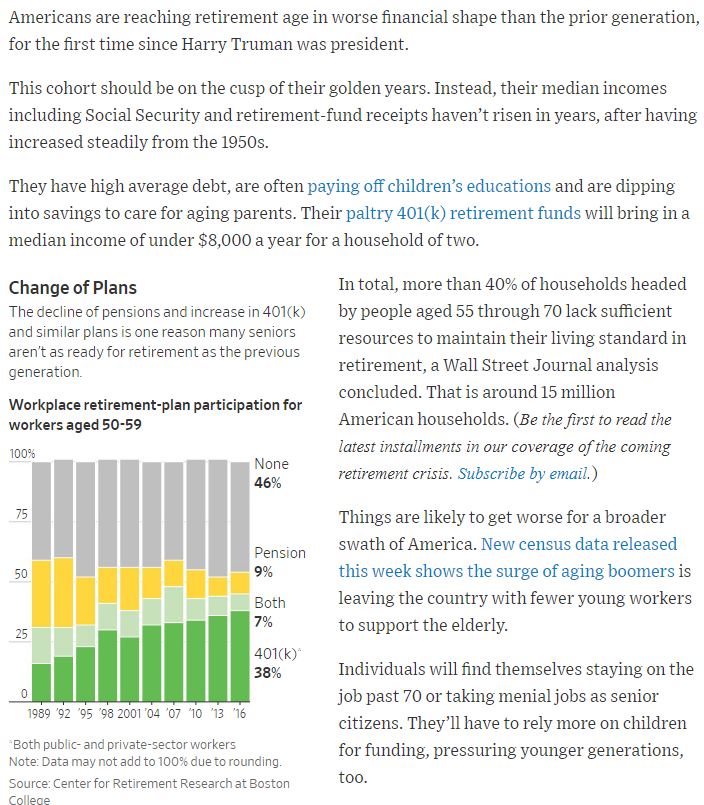
These charts and graphs are from this story in the WSJ:
~~~~~~~~~~~~~~~~~~~~~~~~~~~~~~~~~~~~~~~~~~~~
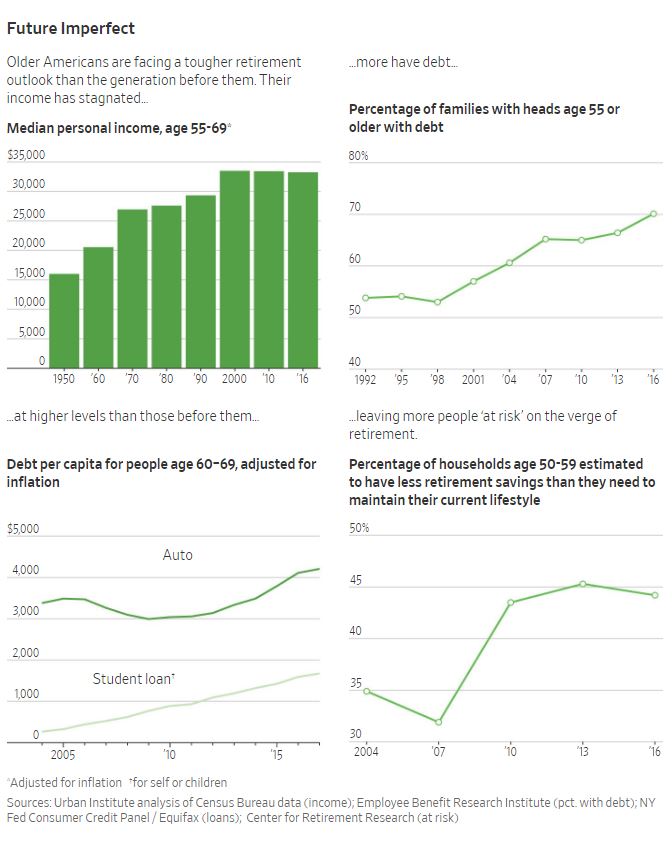
•The percentage of families with any debt headed by people 55 or older has risen steadily for more than two decades, to 68% in 2016 from 54% in 1992, according to the Employee Benefit Research Institute, a nonpartisan public-policy research nonprofit.
•Americans aged 60 through 69 had about $2 trillion in debt in 2017, an 11% increase per capita from 2004, according to New York Federal Reserve data adjusted for inflation. They had $168 billion in outstanding car loans in 2017, 25% more per capita than in 2004. They had more than six times as much student-loan debt in 2017 than they did in 2004, Fed data show.
A combination of economic and demographic forces have left older Americans with bigger bills and less money to pay them.
Tempted by a prolonged era of low interest rates, boomers piled on debt to cope with rising home, health-care and college costs. Interest-rate declines hurt their security blankets. Lower earnings on bonds prompted many insurance firms to increase premiums for the universal-life and long-term-care insurance many Americans bought to help pay expenses. Some public-sector workers are living with uncertainty as cash-strapped governments consider pension cuts.
Gains in life expectancy, combined with the soaring price of education, have left people in their 50s and 60s supporting adult children and older relatives. Some are likely to have to rely on professional caregivers, who are in short supply and are more expensive than informal arrangements of the past.
Read full article here:
Link to WSJ Full Article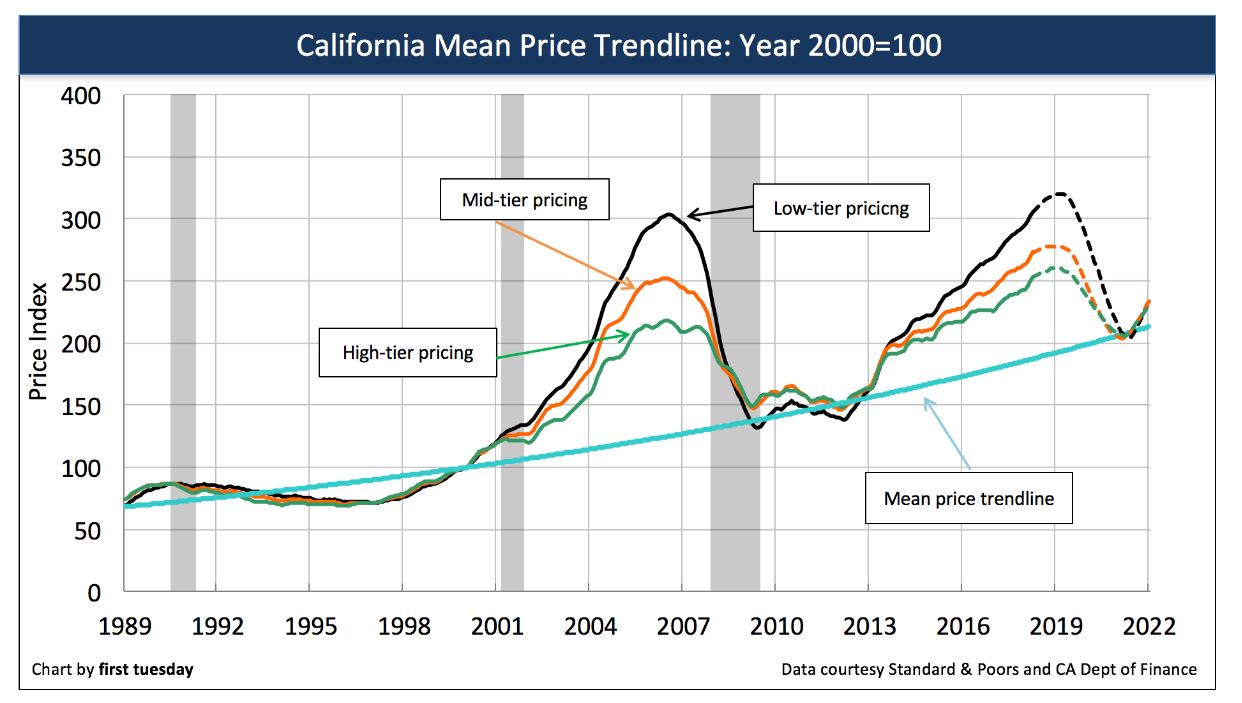
We’re going to be fed a solid diet of ivory-tower analyses from now on, because when you look at the history, it sure seems like home prices are due to come down. What these authors fail to consider is how the Bank of Mom and Dad has made the current pseudo-bubble possible, and will continue to do so. Plus, for prices to go down, you must have sellers who are willing to dump on price. None have been that motivated, at least not yet.
This article can’t even get the facts straight – the last bust was caused by exotic neg-am financing exploding in our faces, and ill-informed homeowners bailing out. In addition, you can draw the trendline anywhere you want, and these authors drew it where it would produce the most drama – see above – yet their worst-case scenario is only back to 2013 prices. We’d survive that.
http://journal.firsttuesday.us/home-prices-run-away-from-incomes-for-now/64911/
This most recent cycle we are emerging from in 2018 has its roots in the early 2000s, when home values began outpacing incomes at a rapid pace.
In 2006, home prices peaked in step with the Millennium Boom. By that time, home sales volume was already falling as buyers sensed prices were too high to continue during the inevitable recession, which arrived in 2008. From 2006 to 2007, prices dropped 16%, followed by a further 26% in the following year.
All in all, California home prices fell 44% from their 2006 peak to their bottom in 2009.
In some ways, this steep fall was a correction to all the excess experienced in the housing market during the early- and mid-2000s. In another sense, the fall was simply the market’s way of bringing home prices back in line with incomes.
There is a name for this reliable force that pulls home prices toward incomes: the mean price trendline.
Through the volatility of housing booms and busts, price increases continue to return to the same rate of annual income change, related to the consumer price inflation (CPI), which is typically 2%-3% per year. In California, this mean price change is closer to 3.5% annually over the past several decades.
How does income impact home prices?
Quite simply, home values can only go as high as incomes allow.
Homebuyers reliant on financing are limited to a maximum mortgage payment of 31% of their monthly income. This translates to the ability to purchase a home costing roughly five times their annual income.
Still, there is some wiggle room in the equation. After incomes, interest rates have the next biggest impact on home prices. When interest rates are falling — as occurred in the 2000s — buyer purchasing power is extended, as homebuyers’ mortgage payments go further. When interest rates rise — as is occurring in 2018 — buyer purchasing power falls and homebuyers are limited to paying less with the same income.
During housing bubbles, home prices become temporarily untethered from this rule and the mean price trendline. During the bust that follows the boom, prices fall, returning once again to the trendline.
Here’s how the situation stands in mid-2018:
Further, the Federal Reserve (the Fed) plans to continue their efforts to increase interest rates in an effort to cool down the economy and induce a moderate business recession by 2020. Not only do higher interest rates discourage potential homebuyers from entering the market, but they cause homebuyers to offer less when they make an offer to purchase.
In response, first tuesday expects home prices to fall by mid-2019, bottoming once they hit the mean price trendline around 2020. Meanwhile, incomes will continue along at their current measured pace, pausing briefly in 2020-2021 in response to the recession.
Link to Article
Hat tip to daytrip for sending in this article, though it somewhat contradicts what I believe – I think you should move somewhere!
Yes, many retirees are looking for a version of Mayberry, the fictional North Carolina town that actor Andy Griffith called home in his 1960s TV show. But even the best Mayberrys, like most communities, have drawbacks.
So, before you pull up stakes, here are some cautionary tales about small towns that retirees have shared with us through the years:
• “I’m here! Hello?” The ideal town is easy enough to envision: a cozy, safe and picturesque spot with—perhaps most essential—a sense of community. It’s important, though, to be realistic about your chances of fitting in with your new surroundings. While you certainly could become part of the inner circle, many transplants find themselves instead joining the ranks of other retirees in the area.
Consider, for instance, this bumper sticker seen in Florida: “We don’t care how you did it up North.” You get the idea.
• Character traits. Along these same lines, and at the risk of overgeneralizing, retirees who relocate often are more assertive, more aggressive and more likely to have been managers or decision makers than those who stay put. (After all, starting a new life in a distant locale isn’t for the faint of heart.) But a strong personality that might have been a big help in the business world might not work as well in an unhurried environment.
In short, ask yourself if the temperament of a possible retirement destination—and, in particular, a small town—is comparable to your own. “I think new arrivals are more concerned about immediate productivity and less patient than those who have been retired 10 or 20 years,” Ms. Carlson says.
• Small—but for how long? Unfortunately, the chances of any small, attractive community staying that way are increasingly slim, as word about such places gets around much faster than before. (Indeed, Ms. Carlson asked us not to identify her new home.) If you do find your Mayberry, the best place to settle—even if you find yourself paying a premium—could be in a historic district, where future development likely will be kept to a minimum.
• Health care. Here’s what Ms. Carlson told us about relocating to a small town: “We were assured, primarily by our real-estate agent, that medical care was excellent. What we weren’t told was that there was a yearlong waiting list for an appointment with most internists. We discovered that there’s an unfavorable ratio of physicians to residents because many younger doctors aren’t interested in an area with limited opportunities for working spouses and a small school system.”
In hindsight, she says, she would have done more digging about health care, as well as asking about emergency care. “Had we asked some questions at the visitor center, instead of just picking up maps and using the restrooms, we might have received more-accurate information,” she says.
“Once we arrived and discovered how hard it is to get into a [medical] practice, I asked at the local fire district: ‘What happens if I have to call the medics?’ I was told that patients with heart problems who must be hospitalized are sent two counties over from us, and that other problems requiring hospital care mean a trip 15 or 20 miles west of here.”
• Transportation. Again, some digging is needed here. A small town is likely to have fewer public-transportation options than a larger community. And remember: You could be living in your new home for a long time. With all that in mind, what happens if you’re forced to cut back, or eliminate, your time behind the wheel? Do volunteer organizations or local government agencies offer transportation programs for older adults?
Says Ms. Carlson of her new town: “Our county has some door-to-door bus service for the disabled, but there appear to be long waits to be returned home. A carwash/gas station operates a single cab. There’s no Uber and no car-sharing rentals.”
And be aware, she adds, “that many small businesses—I’m thinking, in this case, about our local dairy that sells composted manure for gardens and yards—don’t deliver, and may not be able to refer you to delivery services.”
Link to Article
Who is selling?
Over the last few years we’ve seen that most home sellers are the long-time owners, and that trend is continuing.
On the left are the years when the sellers purchased the home they sold between July 26 and August 3rd of this year:
| Year Purchased | |||||||
| 0 – 2003 | |||||||
| 2004 – 2008 | |||||||
| 2009 – 2011 | |||||||
| 2012 – 2018 | |||||||
| New Homes |
The increasing trend of recent purchasers selling might just be from the additional years in the last category. It was 2012-2015 when this graph began, and now it covers seven years – almost twice as many.
Are those sellers moving up or down? Or cashing out?
The younger boomers:
But the younger boomers:
With long-time owners providing the bulk of the inventory, we should expect older homes for sale that need fixing, or at least some updating. Yet the current trend is for buyers getting more picky, not less.
More stats:
| # Sales | |||||||
| Avg. $/sf | |||||||
| Median SP | |||||||
| Avg DOM | |||||||
| 0-10 DOM | |||||||
| Lost $$ | |||||||
| DOM = 0 |
Another analysis from the ivory tower. I’d love to see them survey baby boomers and/or realtors, instead of just guess at what might happen.
Baby Boomers, the largest generation of Americans in history until the Millennials came along, have influenced the country since their birth and have created what could be described as a pig in a python in homeownership rates.
They are ageing, the leading edge of the group is now in their 70s, but still, according to Fannie Mae, inhabit 46 million owner-occupied homes with an estimated $13.5 trillion. What happens to the housing market when that generation, voluntarily or not, exit homeownership? Will the four generations following behind the Boomers step up and assume the mantle of homeownership?
While it doesn’t address the results of this inevitable generational shift, research by the University of Southern California and Fannie Mae’s Economic & Strategic Research Group attempts to determine its timing and how precipitously it might occur by analyzing earlier generations of homeowners. The results are reported on Fannie Mae’s Housing Insights blog in an article by the company’s Patrick Simmons and Dowell Myers representing USC.
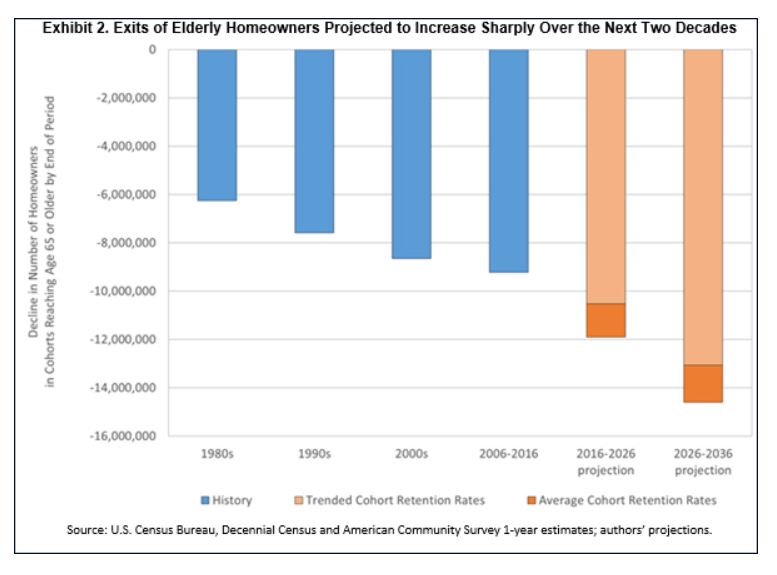
Under all scenarios the authors predict substantial increases in the number of older adults who will exit homeownership over the next two decades.
In the ten years ending in 2016, homeowners who had aged to at least 65 declined by 9.2 million. Over the next ten years, the authors say that number will be 10.5 to 11.9 million depending on the scenarios. Going out ten years more, 2026 to 2036, the 65+ cohorts are projected to shrink by 13.1 to 14.6 million homeowners, a loss at least 42 percent greater than registered during the most recent decade.
The reason these exit numbers increase is, of course, the large number of homeowner adults involved in the relevant cohorts and how each age cohort swells with homeowners as Boomers enter into it. In 2006, when the oldest Baby Boomers were only age 60, the 65-74 age group contained 9.3 million homeowners. By 2016, when the oldest Boomers had reached age 70, that number had swollen to 13.6 million. By 2026, when the youngest Boomers will be age 62 and the oldest age 80, the number of owner-occupants age 65-74 is projected to jump again to about 16.4 million, putting an even greater number of older owners on the precipice of aging-related homeownership attrition.
It will be aging Boomers who will trigger this potential mass exodus, but efforts on the part of industry and government will need to cross generations. One such effort might be to extend the period during which the elderly can remain homeowners such as providing financing for home improvements or community-based support services either of which might allow homeowners to age in place.
At the demand end of the potential problem would be the provision of sustainable home purchase finance options to allow the younger generations to absorb the large number of Boomer homes likely to flood the market. Because immigrants contribute substantially to homeownership demand growth, immigration policy will also likely play a role in determining the adequacy of replacement demand for the homes vacated by Boomers.
The authors conclude that, regardless of the shape such efforts take, “fostering a smooth intergenerational handoff of housing assets will likely require approaches that span the age spectrum and that seek to forge a bond of mutual housing market interests between old and young.”
Link to Full Article

Are you looking for an experienced agent to help you buy or sell a home?
Contact Jim the Realtor!
CA DRE #01527365, CA DRE #00873197
