by Jim the Realtor | Feb 1, 2021 | Contests, Inventory, Jim's Take on the Market

Even though it looks like a record-low inventory for January (251 NSDCC listings so far), the number of pendings increased by 9% in the last week – buyers will not be denied!
I don’t think that the numbers of actives and pendings have ever been this close:
NSDCC Actives: 367
NSDCCC Pendings: 306
The action is weighed on the lower-end:
NSDCC Actives Median List Price: $3,950,000
NSDCC Pendings Median List Price: $1,895,000
~~~~~~~~~~~~~~~~~~~~~~~~~~~~
(more…)
by Jim the Realtor | Jan 18, 2021 | Contests, Inventory, Jim's Take on the Market

Custom mirror/rock wall combo!
Contest update:
We’ve only had 136 new NSDCC listings this month (including the Coming Soons), so matching last year’s count of 353 listings in January looks unlikely. Those with the lower guesses are looking good:
234 – REOAndre
270 – lifeisradincbad
289 – Derek
305 – Joe
311 – Old Man
318 – Doughboy
325 – Haile
333 – Kris K.
347 – Big Crazy
353 – TominLaCosta
What’s not looking good is the idea that buyers will have plenty of choices this spring!
~~~~~~~~~~~~~~~~~~~~~~~~~~~~
(more…)
by Jim the Realtor | Jan 4, 2021 | 2021, Contests, Frenzy, Jim's Take on the Market, North County Coastal |

Happy New Year…..how about a contest to get it started?
My case for a full-blown frenzy is based on having additional supply to fuel the seemingly-insatiable demand brought on by the pandemic – having more homes for sale will help spike sales and prices. Betting on more people selling their piece of paradise sounds insane as the coronavirus rages throughout the region, but we’re overdue – and there are a number of reasons why it could happen:
http://bubbleinfo.s020.wptstaging.space/2020/12/22/my-top-ten-reasons-for-frenzy-2021/
We will know how the selling season will unravel just by the number of new listings in January.
Here is the history:
NSDCC January Listings
| Year |
Number of January Listings |
| 2011 |
367 |
| 2012 |
275 |
| 2013 |
419 |
| 2014 |
425 |
| 2015 |
405 |
| 2016 |
471 |
| 2017 |
395 |
| 2018 |
427 |
| 2019 |
421 |
| 2020 |
353 |
The range is 275-471, the median is 412, and the average is 396 listings. Last year we had 5% fewer listings, but 13% more sales than in 2019. My 2021 prediction is 10% more NSDCC listings year-over-year, 10% more sales, and a 10% increase in the NSDCC median sales price.
OUR CONTEST: GUESS THE NUMBER OF NSDCC LISTINGS IN JANUARY, 2021!
In 2020, saw a big drop-off in January listings year-over-year (-16%), and that was before the pandemic. If we see a similar amount, or fewer, then prices will go nuts but be limited to the neighborhoods that actually have sales, and the lucky few who can win a bidding war.
If we have a surge in listings, then more of the demand will be satisfied and the frenzy will reach more areas – and prices go up faster because of the additional comps, all of which should close for a higher price than the last sale.
Having a contest based on the number of January listings will help to keep our focus on one of the leading indicators for the 2021 selling season.

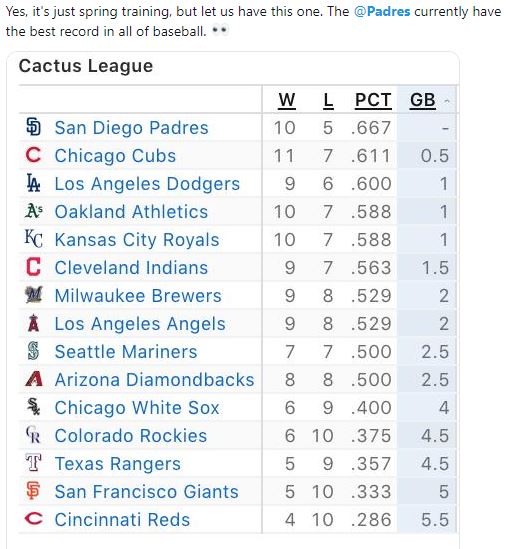
The winner will be who guesses the closest (above or below) to the actual number of January listings as counted on the morning of February 15th. The winner will receive two tickets to a day at the U.S. Open at Torrey Pines, June 17-20, and four tickets to a game with World-Series favorite, the San Diego Padres!
I have purchased tickets to both events already, so as long as the ‘rona cooperates and fans are allowed, we will have prizes. Neither the PGA or the Padres have committed to a set policy on fans yet though, so if they both cancel out then I’ll think of something else for a prize.
Our Padres tickets aren’t front row, but they are decent:

Leave your guess in the the comment section on how many NSDCC SFR listings we’ll have in January!
by Jim the Realtor | Jul 2, 2019 | Contests, Jim's Take on the Market, Market Buzz, North County Coastal, Sales and Price Check |

Bill (in Giants jersey) from the Bay Area has been reading the blog for the last ten years!
He won the earlier contest for Padres tickets, so when he and his family were here on vacation, they took in the first game of the series last night – a 13-2 shellacking by the Giants! They got on TV too:

Congrats Bill and family!
The contest was predicting how many new listings we would have in the first two months of 2019. Bill’s guess was 777, which was the third lowest of those submitted – we all thought more sellers would want to cash out at these prices!
Yesterday’s doomer was looking for the right evidence – historically, one of the first signs of trouble is a surge of inventory. We saw it last time in the first half of 2006 when listings jumped 23% as sellers started scrambling to get out:
NSDCC Detached-Home Listings Jan 1 to June 30:
| Year |
Number of Listings |
Median List Price |
| 2005 |
2,892 |
$1,150,876 |
| 2006 |
3,547 |
$1,120,000 |
| 2007 |
3,120 |
$1,182,500 |
But still no surge here locally in 2019.
Our inventory count this year is looking normal – and 24% under the 2006 count:
NSDCC Detached-Home Listings Jan 1 to June 30:
| Year |
Number of Listings |
Median List Price |
| 2013 |
2,790 |
$1,179,000 |
| 2014 |
2,713 |
$1,120,000 |
| 2015 |
2,871 |
$1,182,500 |
| 2016 |
2,999 |
$1,425,000 |
| 2017 |
2,712 |
$1,425,000 |
| 2018 |
2,700 |
$1,499,000 |
| 2019 |
2,705 |
$1,569,000 |
In the first half of 2005, we had 400 sales close under $750,000, and this year we had 55.
We had 560 homes list for $2,000,000+ in the first half of 2005, and 238 closings. This year, we had 901 listings over $2,000,000, and 298 closings!
by Jim the Realtor | Mar 11, 2019 | Contests, Jim's Take on the Market, Spring Kick |
Padres’ Tickets Contest – Guesses Under 800:
740 – Doughboy
755 – Neil
777 – Bb
785 – Recordsclerk
799 – TominLaCosta
Even if a few more are added in the coming days, Bb is our winner – congratulations! (Bb, contact me for tickets)
Today’s count:
NSDCC New Listings Jan 1 to Feb 28 (as of March 11th):
2018: 783
2019: 767
There was enough concern about how the market wrapped up in the second half of 2018 that I thought we could see more sellers getting an early start in 2019. But there’s no panic – we didn’t even list as many homes as we did in the first two months of 2018, let alone more.
by Jim the Realtor | Mar 4, 2019 | Contests, Inventory, Jim's Take on the Market, Spring Kick |
We’ve had a mini-surge in listings over the last few days! There will be a few more added to the MLS this week, but it looks like the total for the first two months of the year will wind up in the 760-785 range.
NSDCC New Listings Jan 1 to Feb 28 (as of March 4th):
2018: 783
2019: 760
Padres’ Tickets Contest – Guesses Under 800:
740 – Doughboy
755 – Neil
777 – Bb
785 – Recordsclerk
799 – TominLaCosta
We wanted to gauge whether there was any panic setting in among sellers, judged by how many more were rushing their home onto the market early in the selling season. If there would have been a surge of 5% to 10% more listings during the first two months of this year, it could have been a tipping point.
But as it turns out, we’ll be lucky to match last year’s total.
~~~~~~~~~~~~~~~~~~~~~~~~~~~~~~~~~~~~~~~~~~~~~~~~~~
Closed sales are better than expected:
NSDCC Closed Sales:
| Year |
January |
February |
Median SP YTD |
Avg $$/sf YTD |
| 2017 |
175 |
173 |
$1,222,000 |
$513/sf |
| 2018 |
150 |
164 |
$1,294,005 |
$573/sf |
| 2019 |
150 |
171 |
$1,275,000 |
$540/sf |
(Updated March 11th)
The 2019 median list price and sales price were the same $1.275M!
But the NSDCC Pendings are stalling, and now 19% under last year’s total at this time, so I’ll stick with my -20% guess on sales. We got off to a hot start this year, but the enthusiasm is slowing – based on this:
Weekly Total Pendings
| Week |
2018 |
2019 |
% diff |
| Jan |
244 |
217 |
-11% |
| Feb |
262 |
233 |
-11% |
| Feb |
280 |
255 |
-9% |
| Feb |
295 |
263 |
-11% |
| Feb |
318 |
261 |
-18% |
| Mar |
328 |
267 |
-19% |
The average list-price-per-square-foot of listings priced under $1,500,000 has been flat lately, and about the same as last year. But listings priced between $1,500,000 and $2,000,000 are averaging about 10% higher LP/$ than last year.
A sluggish selling season would probably end earlier than usual, but give us at least a couple of more months, please!
(more…)
by Jim the Realtor | Feb 25, 2019 | Actives/Pendings, Contests, Inventory, Jim's Take on the Market, NSDCC Pendings |

Thanks Rob Dawg for the gift!
Our contest for Padres tickets got more exciting this week due to Manny Mania!
NSDCC New Listings Jan 1 to Feb 20:
2018: 681
2019: 644 (-5%)
The two-month total last year was 783, so we’re on a pace to hit 741. Doughboy guessed 740, but it came in after the guessing period ended. If he wins, I’ll give tickets to him and the next closest guesser.
Others who guessed under 800:
755 – Neil
777 – Bb
785 – Recordsclerk
799 – TominLaCosta
We finally hit a statistical oddity that we’ve been flirting with for months. The average list-price-per-sf of the Under-$1,000,000 category caught up with the next category, $1.0M to $1.5M.
Both are at $494/sf today!
There was another quirk also. The new listings AND the new pendings both dropped off over the past week, which is unusual for this time of year. It must have been due to the rain?
The total number of pendings today is 18% behind last year.
Looking ahead to next month? It starts Friday! We had 446 new listings in March of last year, which was 25% more than in February, 2018.
(more…)
by Jim the Realtor | Jan 7, 2019 | Contests, Inventory, Jim's Take on the Market |

It was suggested that we change the price categories again, and the start of the new year would be a good time to do it.
But I’m going to leave them be, for two reasons: A) Pricing, and the market in general, has stalled – literally we have twice as many NSDCC active listings priced under $1M today as we did a year ago (72 vs. 36), and B) I want to compare apples and apples to 2018 throughout the year.
If you took an extended vacation and are just getting back in the swing, scroll back a few posts (or click here) to register your guess of how many total listings we will have between Jan 1 and Feb 28 – the closest will receive four tickets to a Padres game!
(more…)
by Jim the Realtor | Jan 2, 2019 | Contests, Inventory, Jim's Take on the Market, Market Conditions, North County Coastal |

Big Papi’s last game in SD
Would you like some guidance on what to expect in the Spring Selling Season?
Let’s monitor how many new NSDCC listings are hitting the market!
If the negative media hype is starting to worry sellers, they will hurry up and list their home early. If we see a surge of new listings in the first two months of the year, it means a buyers’ market is forming.
If we have about the same or fewer listings in early 2019, then sellers will just shrug off any concerns and wait their turn.
Here are the counts of listings inputted onto the MLS in January and February from the last few years:
NSDCC New Listings, Jan & Feb
| Year |
Jan+Feb Listings |
Median List Price |
Median DOM |
| 2012 |
794 |
$954,500 |
88 |
| 2013 |
785 |
$1,130,000 |
37 |
| 2014 |
802 |
$1,295,000 |
42 |
| 2015 |
821 |
$1,345,000 |
37 |
| 2016 |
917 |
$1,489,900 |
46 |
| 2017 |
787 |
$1,499,876 |
38 |
| 2018 |
782 |
$1,599,000 |
35 |
The average is 813 listings, and with the last two years both being lower, it would take a significant YoY increase to worry most participants. But at least we’ll know first!
Put your guess in the comment section of how many new listings we’ll have in January and February, and on March 15th we’ll see who is closest.
The winner will get four tickets to a Padres game! The photos here were taken from the seats, and I’ll have about ten dates available.

Larry Baer, CEO of the SF Giants


by Jim the Realtor | Dec 30, 2018 | Contests, Forecasts, Jim's Take on the Market, Market Buzz |

We’re going to start a contest for Padres tickets in the new year, so let’s get a read on how things wrapped up in 2018.
We know that NSDCC sales were down 10%, and the median SP was up 8%. Sales of detached homes in San Diego County were down 11%, and the median sales price was up 7%.
If sellers were feeling a sense of panic about the market – and prices – we would be seeing more new listings hit the market.
Have there been more listings than usual lately?
NSDCC Listings, 4th Quarter
| Year |
4th Qtr Listings |
Median List Price |
Dec. Listings |
Median List Price |
| 2013 |
727 |
$1,199,000 |
164 |
$1,090,000 |
| 2014 |
761 |
$1,199,000 |
150 |
$1,185,000 |
| 2015 |
866 |
$1,348,500 |
200 |
$1,137,450 |
| 2016 |
836 |
$1,377,500 |
201 |
$1,375,000 |
| 2017 |
753 |
$1,549,900 |
153 |
$1,495,000 |
| 2018 |
842 |
$1,536,900 |
154 |
$1,524,000 |
The other comparisons we’ve done have shown that the 2018 stats have mostly been similar to previous years. But once we have the complete total for new listings, it looks like the 4Q18 number is likely to be at, or above, all of the recent years. It’s already 12% above last year, and the MLP is actually lower.
There were fewer December listings, but that means the October/November count was higher than ever. With soggy conditions in place already, did potential sellers this month decide to wait for a 2019 launch?
Will we see a surge of new listings in early 2019?