Last Wednesday I was discussing the current market conditions with Candis while at her listing of a Davidson home on Calle Pera – which we both thought was priced right and should be selling in spite of it being on the market for 50 days.
I mentioned to her that it seemed like home buying comes in waves, or surges now. The market goes quiet for a few weeks, then a bunch of homes will sell at the same time. We agreed that her listing should be the next to go pending….and if/when it does, will several more will go pending too?
Looks like it!
Since Wednesday, we’ve had 63 new pendings, including hers on Calle Pera! You could say that we’re just coming off the holidays, but this isn’t the spring selling season…yet. Or is it?
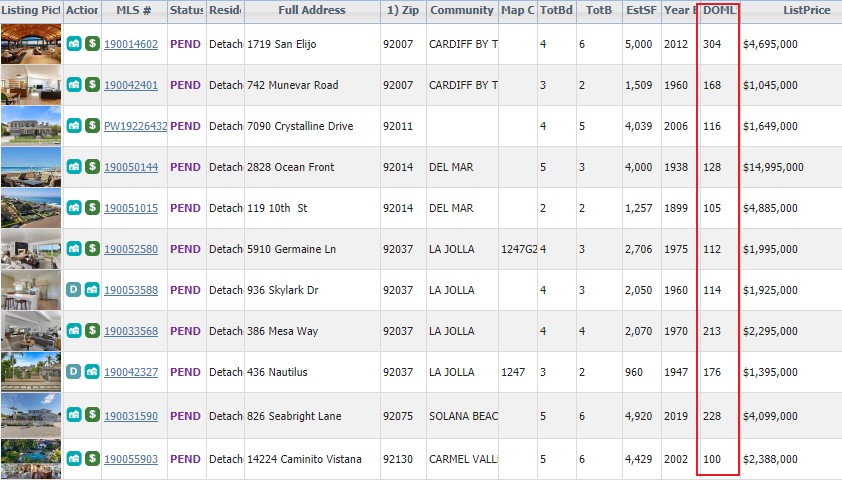
It’s not just the hot new listings either – only 15 of the 63 new pendings had been on the market for seven days or less. Here are eleven that had been on the market for 100+ days:
When eleven homes go pending that have been on the market for months, it’s not a fluke – those are retail sales happening early! With good weather and no football this weekend, the lucky streak should continue.
Are you waiting to put your home on the market? The reason to list it sooner instead of later is to avoid competition. There probably aren’t many if any other listings around you now, and that could change in a hurry – and have impact on your eventual sales price.
I’m nervous about the competition between two-million-dollar condos in downtown San Diego, so I put our new listing on compass.com as a Coming Soon to gain some awareness among buyers while we do a quick spruce up. It appeared on our website yesterday morning, and since then Compass agents have inputted another 19 new Coming-Soon listings!
Hopefully the early momentum will feed on itself. Let’s go!!
The severe shortage of homes for sale is upending the sales calendar for the whole housing market. Spring has historically been the busiest buying season, but as competition for homes heats up across the country, January is the new April. Spring starts now.
The numbers are telling. From 2015 through 2018, the peak month for average views per listing on Realtor.com was April. January lagged by a full 16%. In 2019, however, January was the busiest month on the site in 20 of the largest 100 metropolitan markets.
Those markets included New York City, Los Angeles, Chicago, Dallas, Houston, Seattle, San Francisco, Atlanta, Denver and San Jose, California. In 2018, January was the busiest month in just three of the largest 100 markets. This year, the expectation is that January will be the strongest month in even more markets.
“As shoppers modify their strategies for navigating a housing market that has become more competitive due to rising prices and low inventory, the search for a home is beginning earlier and earlier,” said George Ratiu, senior economist at realtor.com. “With housing inventory across the U.S. expected to reach record lows in 2020, we expect to see this trend continue into the new year.”
The home-buying season used to kick off sometime in spring, as the snow began to melt and people tried to plan for a summer move-in. But in recent years, the limited supply of homes for sale has spurred buyers to start their hunt earlier and earlier—and now, they’re jumping into the market en masse in January, according to a recent realtor.com analysis. Happy New Year, now start house hunting!
In about 20% of the nation’s largest housing markets, January was the month in which buyers logged the most listing views, the realtor.com team found. The analysis looked at the number of monthly views on realtor.com from 2015 to 2019—and discovered the extent of spring market creep, as buyers try to get ahead of the competition for the few homes on the market.
“As shoppers … [navigate] a housing market that has become more competitive due to rising prices and low inventory, the search for a home is beginning earlier and earlier,” says realtor.com’s Senior Economist George Ratiu. And as more homes aren’t expected to go onto the market anytime soon, ”we expect to see this trend continue into the new year.”
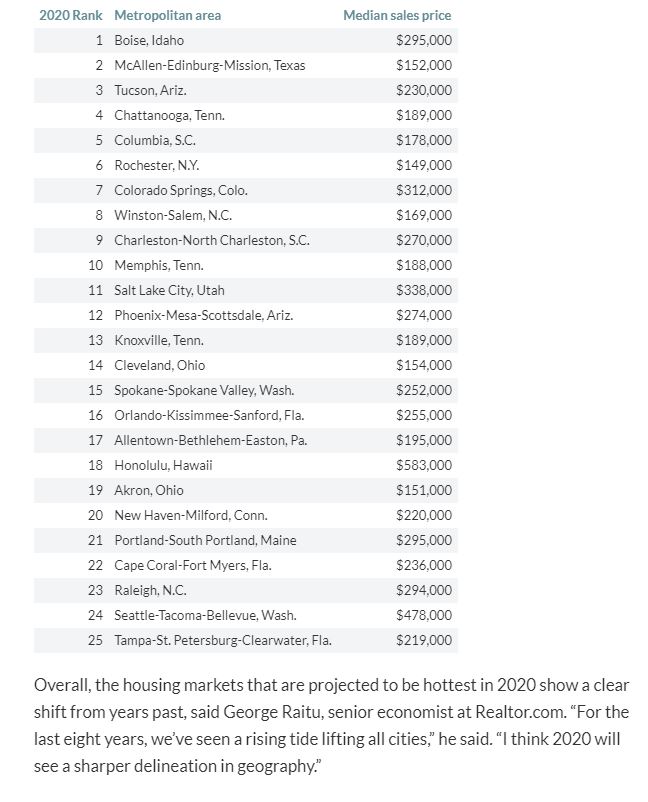
Forget Seattle, Denver and San Francisco. Boise, Idaho, is poised to be the hottest housing market at the start of the next decade.
A new report from Realtor.com identified the housing markets that are expected to see the most notable home sales and price growth in 2020. Boise ranked No. 1, a marked increase from No. 8 a year ago.
Driving Boise’s climb up the Realtor.com ranking is the massive influx of new residents from pricier parts of the country — in particular, California. Many of these out-of-state buyers are drawn by the city’s mild climate, outdoor lifestyle, strong schools and its major employers, including HP and Micron Technologies.
Boise’s already seen a boom in terms of housing. A recent report from the Federal Housing Finance Agency showed that home prices in the Idaho state capital have risen 11.1% over the last year.
After Boise, McAllen, Texas, and Tucson, Ariz., ranked No. 2 and No. 3 on Realtor.com’s list. McAllen’s affordable home prices, combined with Texas’ favorable tax environment, have made the border city an attractive destination for home buyers looking to move. Tucson, meanwhile, has benefitted from an influx of retirees looking for warm weather and young adults looking to study at the University of Arizona or work for popular companies that have set up shop there like Amazon and Texas Instruments.
Meanwhile, some of the parts of the country that have proven to be among the most popular in recent years are expected to see a bit of a correction in 2020. Las Vegas, which ranked No. 7 last year, has dropped to the bottom of Realtor.com’s list for 2020. Sin City for a long stretch of time saw bumper home price growth, but the housing market there has cooled in recent months.
Similarly, sky-high home prices in places like San Diego, New York and Los Angeles are poised to put a damper on real-estate activity in those areas as most buyers are forced to the sidelines due to a lack of affordability.
In three out of the last four years, our highest median sales price was in May – which are the sales that were decided in March and April:
I think we can expect a similar fast start to the selling season next year as pent-up demand that went unsatisfied in 2019 rushes in and grabs something just to get it over with while rates are still in the threes.
The average cost-per-sf is more choppy due to being skewed by abnormal sales prices, but this graph demonstrates the same – look at the hot start we got in Feb-May in both of the last two years:
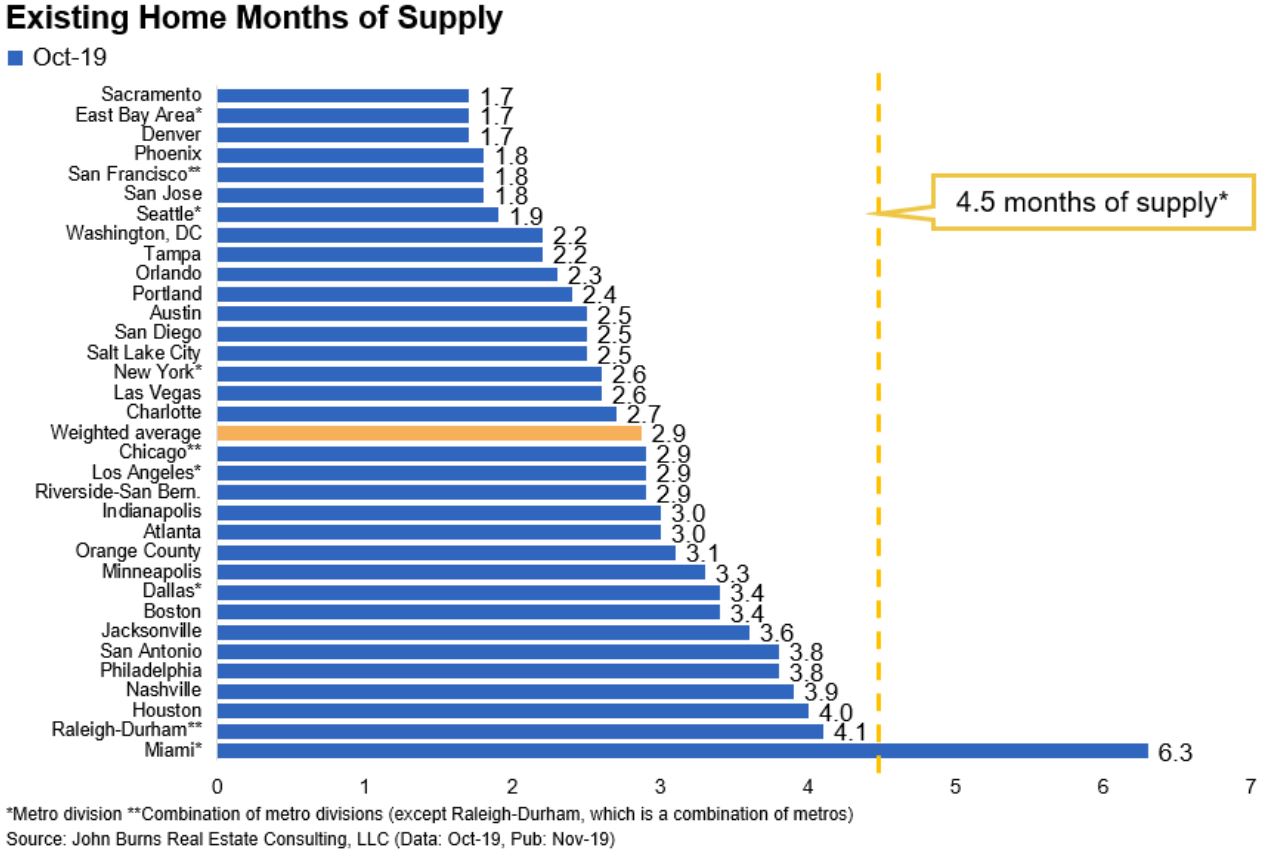
Above you can see how our market compares to others, and below is the history of our ‘months of supply’. I said in the video yesterday that I thought the NSDCC sales in 2020 will be down 10% year-over-year mostly because there aren’t enough reasonably-priced homes to sell (or conversely, there aren’t enough buyers who can/will overpay for the multi-million-dollar homes).
I think you can see some of the price resistance lately as the orange line got into the 3s the last two years. We’ve seen how the velocity of the price increases has slowed considerably and when that happens, the natural next step for the market is fewer sales.
The orange line hit 3.0 in April of this year, when the previous April it was only 2.4, which means the inventory grew quicker at the start of the selling season. Expect the same in 2020, and when buyers see a rapidly growing inventory, it’s natural for them to be cautious and picky.
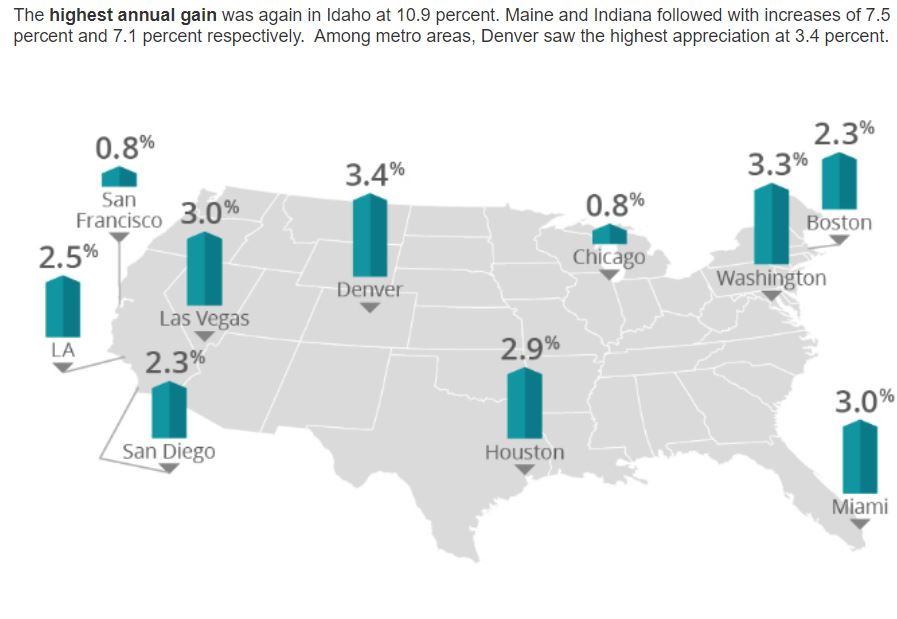
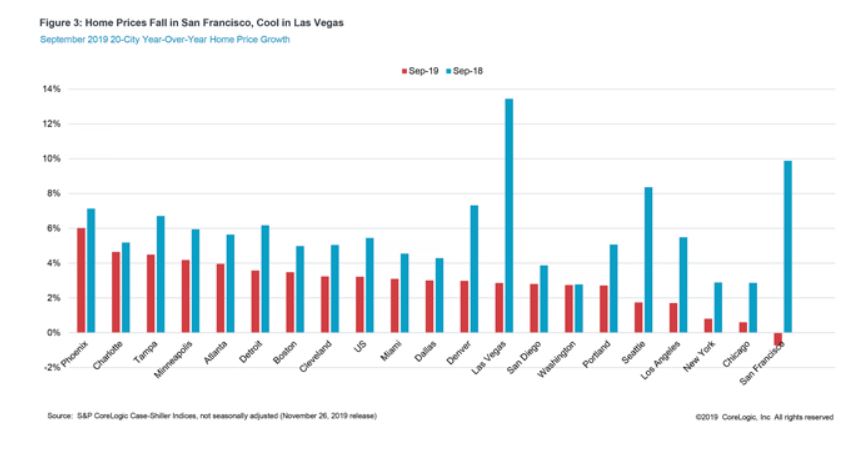
Home prices increased on an annual basis by 3.5 percent in October according to CoreLogic’s Home Price Index (HPI). The index rose 0.2 percent from the previous month.
The rate of increase in home prices appears to have stabilized for the moment. After trending higher for several years, the HPI hit a recent peak of 6.62 percent in April 2018, then decelerated to 3.53 percent by the following March. Since then it has moved back and forth over a narrow range, 3.3 to 3.6 percent.
Frank Nothaft, CoreLogic’s chief economist, said “Local home-price growth can deviate widely from the change in our U.S. index. While we saw prices up 3.5 percent nationally last year, home prices also declined in 22 metropolitan areas. Price softness occurred in some high-cost urban areas and in metros with weak employment growth during the past year.”
The CoreLogic HPI Forecast indicates that home prices will increase by 5.4 percent on a year-over-year basis from October 2019 to October 2020. They are expected to increase by 0.2 percent from October to November of this year. The CoreLogic HPI Forecast is a projection of home prices using the CoreLogic HPI and other economic variables.
CoreLogic’s current Market Conditions Indicators (MCI) show 35 of the country’s 100 largest metropolitan areas based on housing stock were overvalued as of October. The MCI analysis categorizes home prices in individual markets as undervalued, at value or overvalued by comparing home prices to their long-run, sustainable levels, which are supported by local market fundamentals such as disposable income. Those markets where home values are 10 percent higher than those long-term levels are considered overvalued and those 10 percent below are considered undervalued. The MCI placed 27 areas in the undervalued category and 38 at value as of October.
During the second quarter of 2019, CoreLogic, together with RTi Research of Norwalk, Connecticut, surveyed Millennials about their housing sentiments. Three out of four told researchers they are confident they would qualify for a loan with their current financial situation. Still, despite this confidence, more than half of the cohort cites buying a home as a stressful experience, noting spending the majority of their savings as one of the leading stressors.
This article features our favorite topic today, and they smartly differentiated between areas. I looked up my sales over the last two years and 22% of them involved the last move of the seller (either they had passed away, or close).
Excerpts:
The big question looming in this neighborhood—and dozens of others like it in the Southeast and Rust Belt—is what happens to everything from home prices to the local economy when so many homes post ‘For Sale’ signs around the same time?
The U.S. is at the beginning of a tidal wave of homes hitting the market on the scale of the housing bubble in the mid-2000s. This time it won’t be driven by overbuilding, easy credit or irrational exuberance, but by an inevitable fact of life: the passing of the baby boomer generation.
One in eight owner-occupied homes in the U.S., or roughly nine million residences, are set to hit the market from 2017 through 2027 as the baby boomers start to die in larger numbers, according to an analysis by Issi Romem conducted while he was a senior director of housing and urban economics at Zillow. That is up from roughly 7 million homes in the prior decade.
By 2037, one quarter of the U.S. for-sale housing stock, or roughly 21 million homes will be vacated by seniors. That is more than twice the number of new properties built during a 10-year period that spanned the last housing bubble.
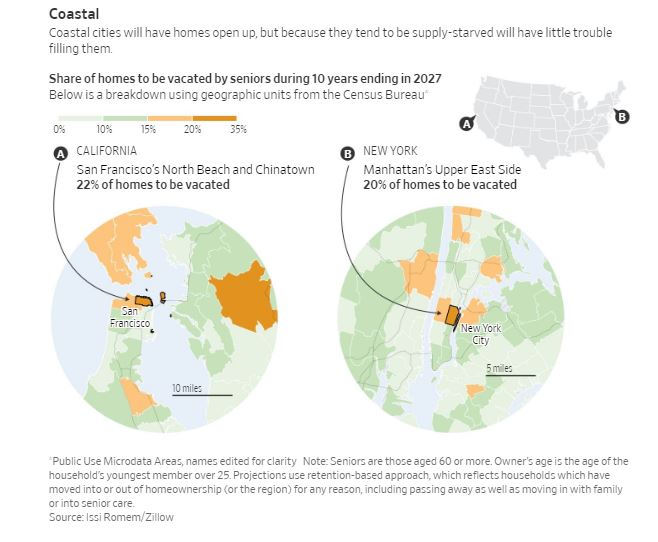
Most of these homes will be concentrated in traditional retirement communities in Arizona and Florida, according to Zillow, or parts of the Rust Belt that have been losing population for decades. A more modest infusion of new housing is expected in pricey coastal neighborhoods of New York or San Francisco where younger Americans are still flocking in large numbers.
But the buyers coming behind the baby boomers, the Gen Xers, are a smaller and more financially precarious generation with different preferences, posing a new kind of test for the housing market.
One problem is that the bulk of the supply won’t necessarily be in places where these new buyers want to live. Gen Xers and the younger millennials have shown thus far they would rather be in cities or suburbs in major metropolitan areas that offer strong Wi-Fi and plenty of shops and restaurants within walking distance—like the Frisco suburbs of Dallas or the Capitol Hill neighborhood of Seattle.
They have little interest in migrating to planned, age-restricted retirement enclaves in sunnier corners of the U.S. lined with golf courses, community centers and man-made lakes—like The Villages, a community of 115,000 in central Florida. Innovations such as voice-recognition technology and ride-share drivers are also making it easier for older people tostay in their existing homes and eschew these retirement communities altogether.
Another challenge is that younger buyers also may not have the financial strength to absorb all of this new supply. New research from Harvard University’s Joint Center for Housing Studies found that households in their preretirement years, age 50 to 64, are less likely to own a home than prior generations, have suffered from stagnant income growth since 2000, and are more debt-burdened, including by student loans.
The consequences of a housing sales glut are potentially wide-reaching. A mismatch between supply and demand in places like Florida, Arizona and Nevada could offer new fiscal challenges that are already familiar to aging cities of the Rust Belt: a shrinking tax base and less money for crucial services like roads and police. Home construction could also falter, dampening an important contributor to the local economy.
“To the extent the local economy is dependent on a vibrant senior population, then it will be more difficult,” said William Frey, a senior fellow in the Metropolitan Policy Program at the Brookings Institution. “Homes will be up for sale and not bought as quickly.”
Housing prices are already stagnating in some places like St. Louis and Youngstown, Ohio as older people die and young people aren’t there to replace them, according to Zillow.
More vulnerable, he said, are small towns and rural areas where young people are less likely to migrate, depressing housing prices indefinitely. “Those are the places that are going to seriously struggle,” he said.
One year after Amazon selected Arlington, Va., as the site of its new HQ2, the impact on the housing market has been pronounced. Massive inventory shortages, sky-high price spikes and a blistering pace of sales are now the norm in the metro surrounding Amazon’s second headquarters, propelling it to one of the nation’s hottest housing markets, according to research by realtor.com.
In contrast, New York City, which was initially chosen as one of the two markets for Amazon’s headquarters, is now sitting at a 15 percent decline in home sales, year-over-year. At the time of the announcement, Manhattan saw a massive leap in home sales of 50 percent. Sales in Manhattan maintained strong double-digit growth until February, when Amazon decided to pull out of New York. At that point, sales growth immediately decelerated and then started declining. The median sale price in Manhattan currently sits at $1.04 million, down 15 percent year-over-year.
“The ‘Amazon effect’ has branched out of its home base of Seattle and it has clearly stamped its fingerprint on the Northern Virginia housing market. The impact of the company’s expansion in the suburbs of Washington, D.C. diverges along homeownership lines, with homeowners experiencing noticeable equity gains and buyers feeling the sting of higher prices,” according to George Ratiu, senior economist at realtor.com®. “Following Amazon’s initial announcement that it was scouting cities for a second headquarters, we knew the winner would see a considerable jump in demand for housing, especially from investors and speculators looking to cash in on increased demand. Looking back a year after the announcement, we can see how dramatic the move has been in the market.”
Immediately following last year’s announcement, home sales in Arlington jumped 21 percent year-over-year as investors swarmed in on the area. Initially, the area saw a substantial 17 percent increase in median listing price, but it has only gone up from there. The median listing price in Arlington County reached $863,000 in October 2019, up 33 percent year-over-year.
In part, the massive price appreciation is due to the lack of inventory and swelling demand for housing in the area. As of October 2019, active listings in Arlington County were down 49 percent year-over-year. Without inventory available to meet current demand, buyers are extending their home search farther out. In Northern Virginia, which is made up of 14 counties, active listings are down 26 percent year-over-year.
The lack of available homes has all but assured that any home hitting the market is bought almost instantly. Half of all homes in Arlington are selling in under 28 days — nine days faster than a year ago and 38 days faster than the national median days on market. The market conditions which have catapulted Northern Virginia into one of the nation’s most competitive housing markets can be traced back to two story lines, according to Ratiu.
“First, the nationwide competition drew so much attention, it caused a massive shortage of homes as investors descended on the area, buying homes as quickly as they could. Second, homeowners and investors have been holding out on selling, anticipating that prices will only continue to increase further, which has compounded the area’s inventory shortage, and further increased home prices, testing the area’s limits for what buyers are willing to pay,” he said.