The local market got off to a hot start in 2024 (January was hot – something to remember in 2025), so it follows that the selling season could conclude sooner than hoped. Let’s use the data to help decide it.
The NSDCC inventory peak of the year has been in mid-July recently:
July 17, 2023: 430
July 25, 2022: 480
July 19, 2021: 392
When we include the Coming Soons, the number of active listings today is 495 which blows right by the high counts of previous years – and we’re not done yet. The actives will be stacking up for another few weeks before sellers get discouraged and give up on 2024.
How about closed sales? They are the best indicator of all.
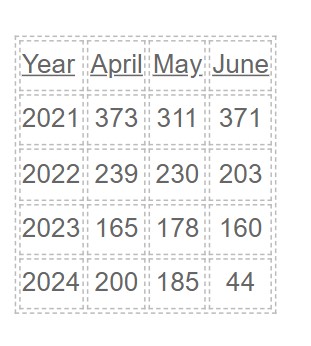
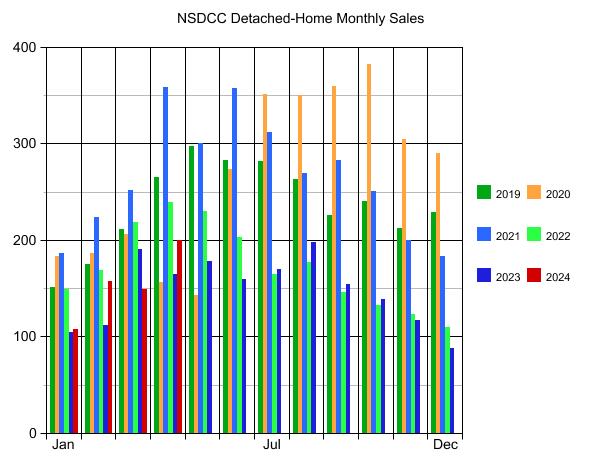
NSDCC Monthly Sales
The April sales this year will probably be the high point of 2024. There are 169 pendings today, and 117 of those went pending before June 1st so they have a good chance of closing this month. But adding those to the 44 already closed only gives us 161 sales for June.
It’s ok that the peak has come and gone already for this year.
It just means pricing needs to be sharp – sharper than ever – for the duration!
It’s natural to wonder what is going to happen next.
Today’s hot employment report squashed any hope for lower rates this summer. Home sales are waning. The realtor cartel is a mess. Yet, more listings are hitting the market at all-time high prices without any regard for market conditions.
Home sellers don’t care – they just want their money.
Let’s reflect upon a case we had here at the end of 2022. We know that Carmel Valley has excellent schools and tend to draw the affluent family buyers, which is great for those who can afford $3,000,000+ now.
One of the first neighborhoods built in Pacific Highlands Ranch was a group of what is now considered smaller homes on tiny lots with zero lot lines.
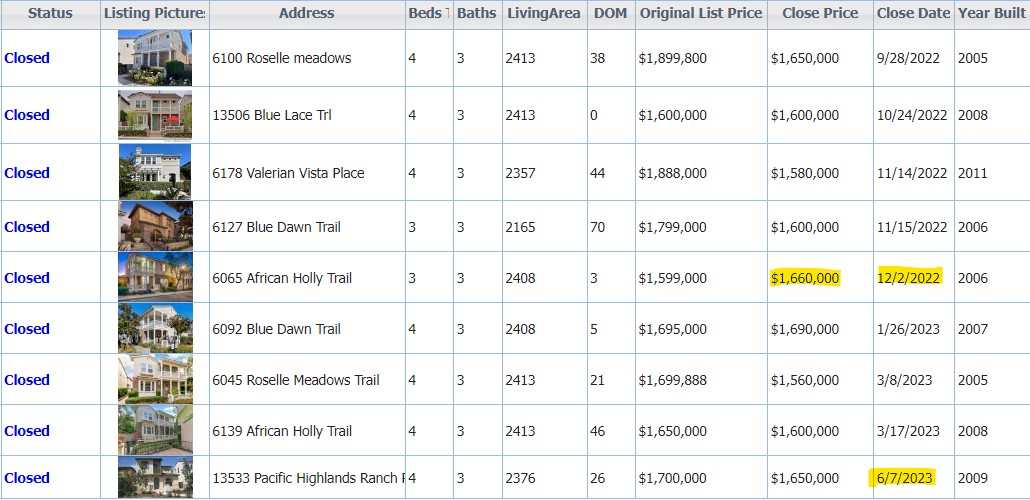
After the mortgage rates took off in 2Q22, the sellers there waited as long as they could – but finally started dumping on price to get out. These are in the order of closing dates – check the first four sales:
When we listed 6065 African Holly, I was determined to stop the bleeding. What good would it do to to list for $1.7 or $1.8 when the last three sales were $1,600,000?
It worked. We got a bidding war started and a cash buyer who was picking up rentals in the neighborhood was the winner, paying $1,660,000.
What’s happened since?
The next four sales sold for about the same, roughly, with three of the four homes taking weeks to find a buyer even though this is PHR entry-level and these are walking distance to Trader’s Joe which has to account for something.
The most interesting fact?
Not one home has listed for sale in the last 12 months!
NO ONE IS MOVING!
The same thing is happening in La Costa Valley, a master-planned community of 1,075 houses built mostly in the late 1990s – and stock full of empty-nesters loaded with equity. In 2024, there have been 12 LCV listings so far, out of 1,075!
I think we could see two things coming down the pike:
As the market slows, fewer people want to sell because they get the idea that the market is ‘bad’.
Estate sales make up most of the inventory.
It would mean that inventory in the newer neighborhoods (less than 30 years old) will dry up like a peach seed, and most of the action will be selling the fixers in the older neighborhoods.
Earlier this year, I speculated that the market could endure – and probably snap up – additional inventory, as compared to last year. The 2023 inventory was like the Mohave Desert!
It seemed that 10% to 15% more would be easily digested, and maybe even +20% or +25%.
Bill’s new stats out today suggest how much, is too much:
None of the pricing metrics are great but at least they demonstrate the trends over time. These graphs above are showing the latest data, including last month, and it’s all fairly positive….for now. With the extra inventory, buyers aren’t going to pay crazy money unless they see the perfect house. Sellers aren’t going to give them away though, so the trend for the rest of 2024 should be flat.
These graphs are interactive so scroll over to see the numbers.
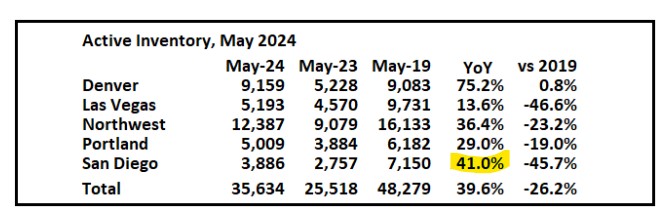
There is extra unsold inventory but nobody is going to call this a flood, especially vs. 2019:
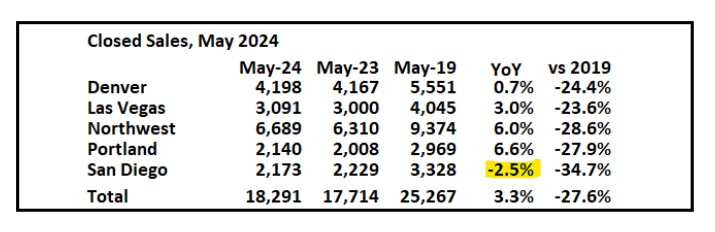
Sales will suffer as long as rates and prices are high. Have we gotten used to having fewer sales yet? The trend is going to last a while – probably for years to come:
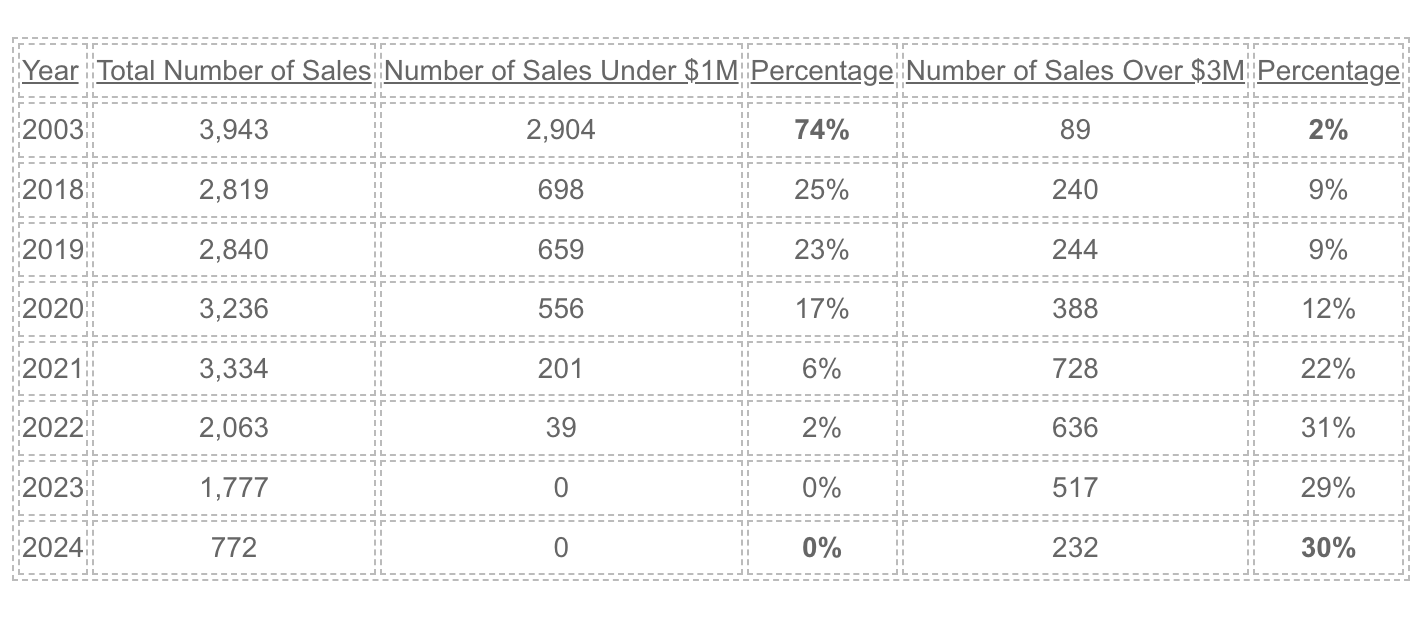
Here’s a snapshot of how fast the local market has changed. It went from a relatively-modest suburban area where 3/4s of the houses sold for less than a million dollars in 2003……to a very affluent market!
NSDCC Detached-Homes Annual Sales
True, the inflation rate since 2003 was 70% and a dollar doesn’t buy what it used to back then. But the median sales price went up from $730,000 in 2003 to $2,344,000 this month – an increase of 320%!
Can we use statistics to describe the market conditions today?
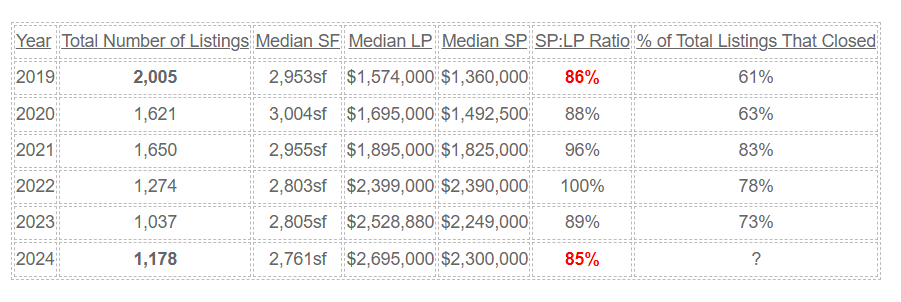
This chart above helps a little. Even though the number of listings is drastically lower than it used to be, apparently the market has been adjusting – mostly by price!
I mentioned that it seemed like everything is priced $200,000 more than it was last year, and the median list price reflects a similar number. Buyers aren’t taking the full plunge though, and the 85% SP:LP is a sign of normalizing (buyers having more negotiating power).
The frenzy that caused virtually everything to sell is long gone, and we’ll probably be back to having 30% to 40% of the listings not selling. This chart doesn’t show the number of refreshed listings where agents cancel and then re-input right away to “refresh” it – but be on the lookout. We will be seeing more of those this year.
Statistically, the market conditions look fairly healthy. Though different than the recent past!
How does our market keep trucking along with sky-high prices AND mortgage rates 2x higher than they were three years ago? How does pricing levitate when money is so much more expensive – shouldn’t prices adjust downward?
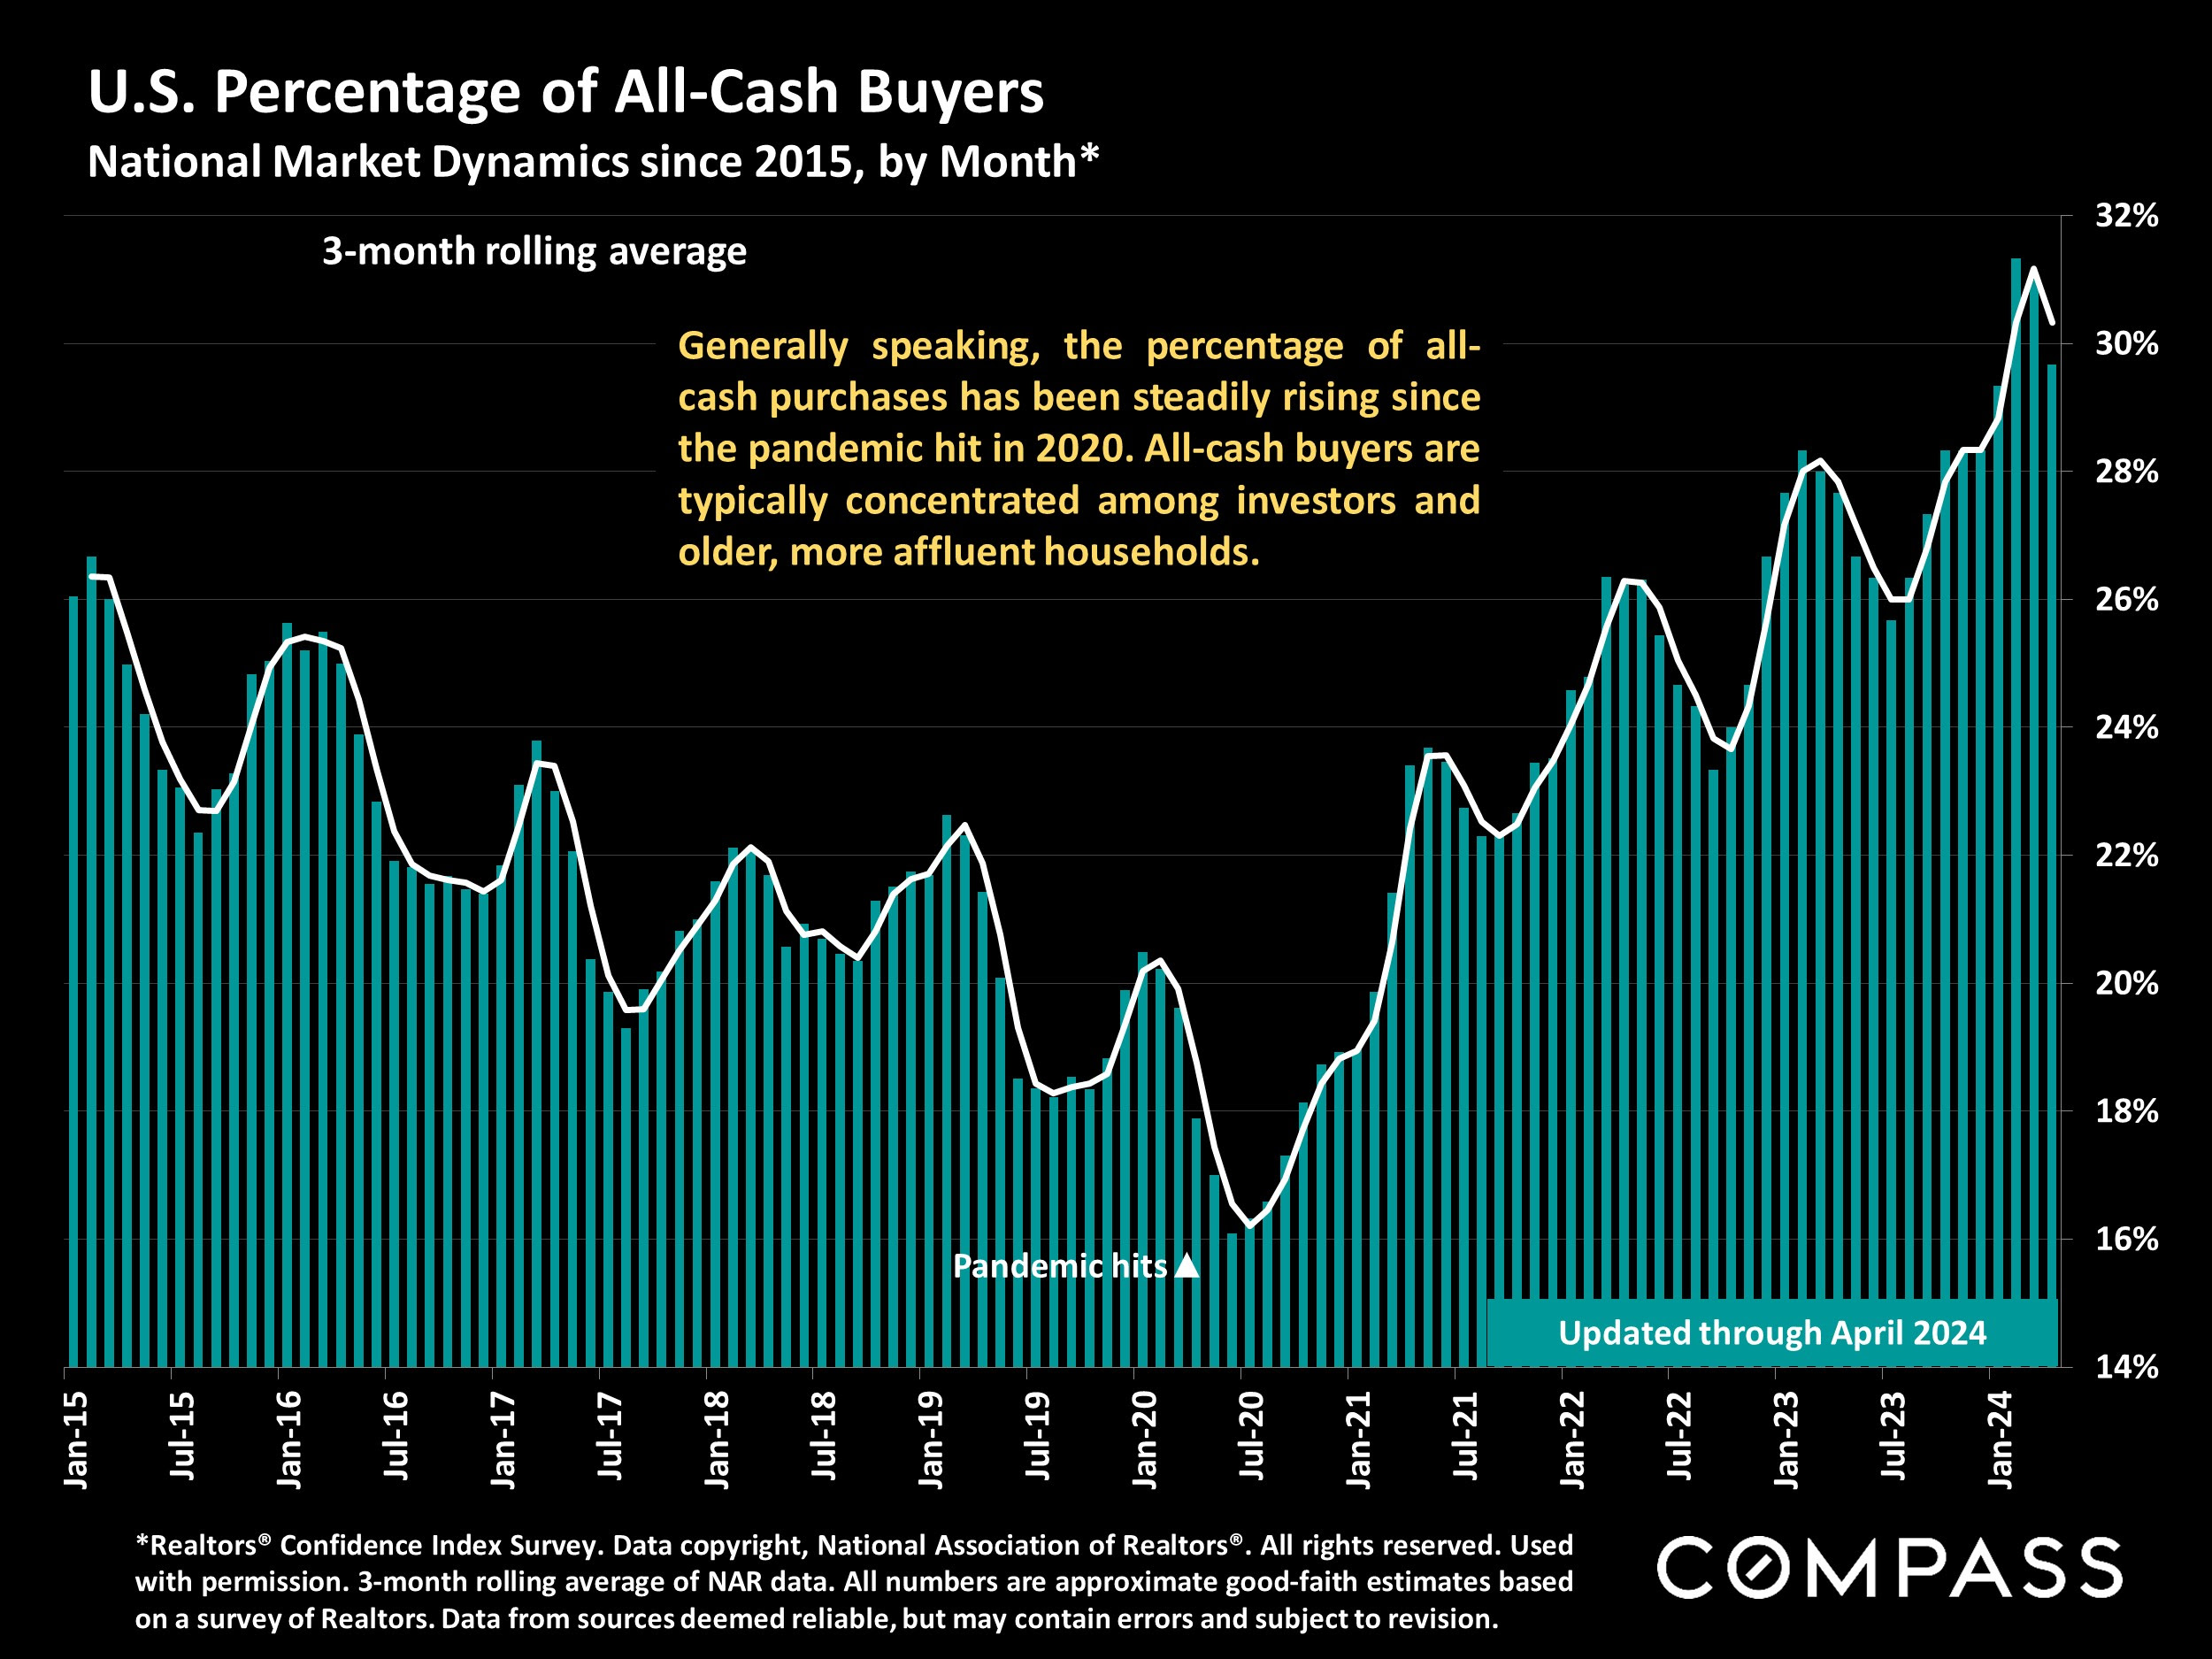
We know that the generational wealth transfer of $70 to $80 trillion dollars is underway, and this is where some of it is showing up – purchases of quality real estate.
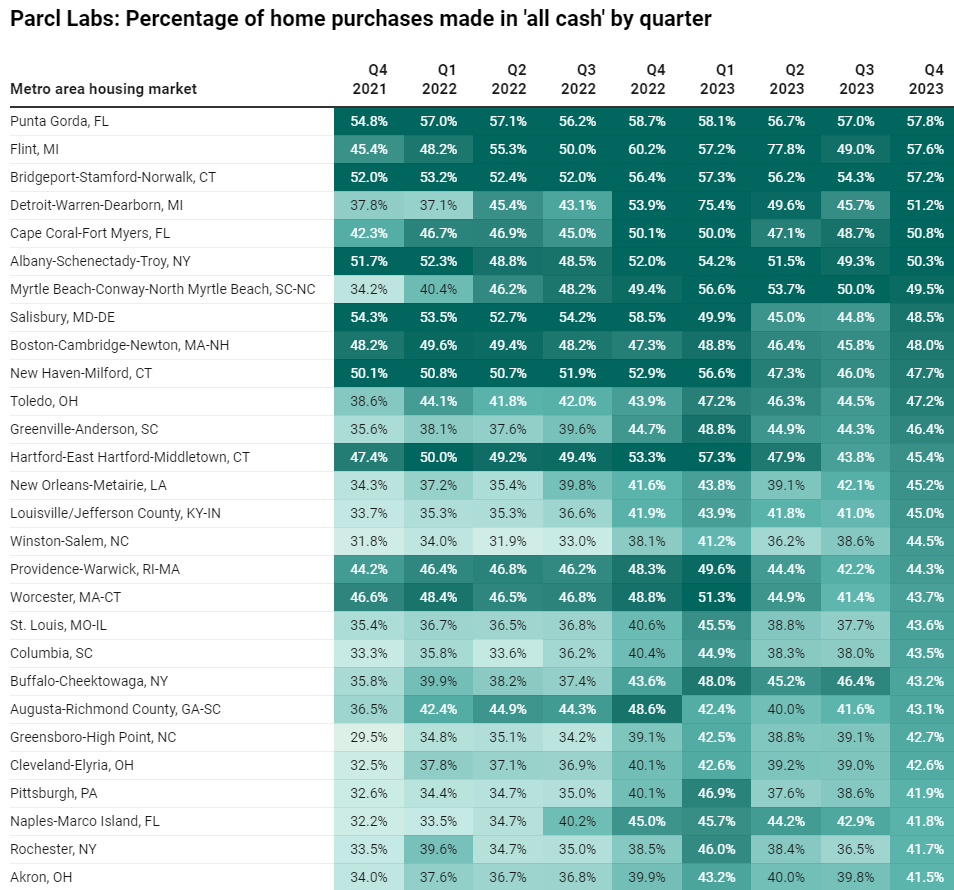
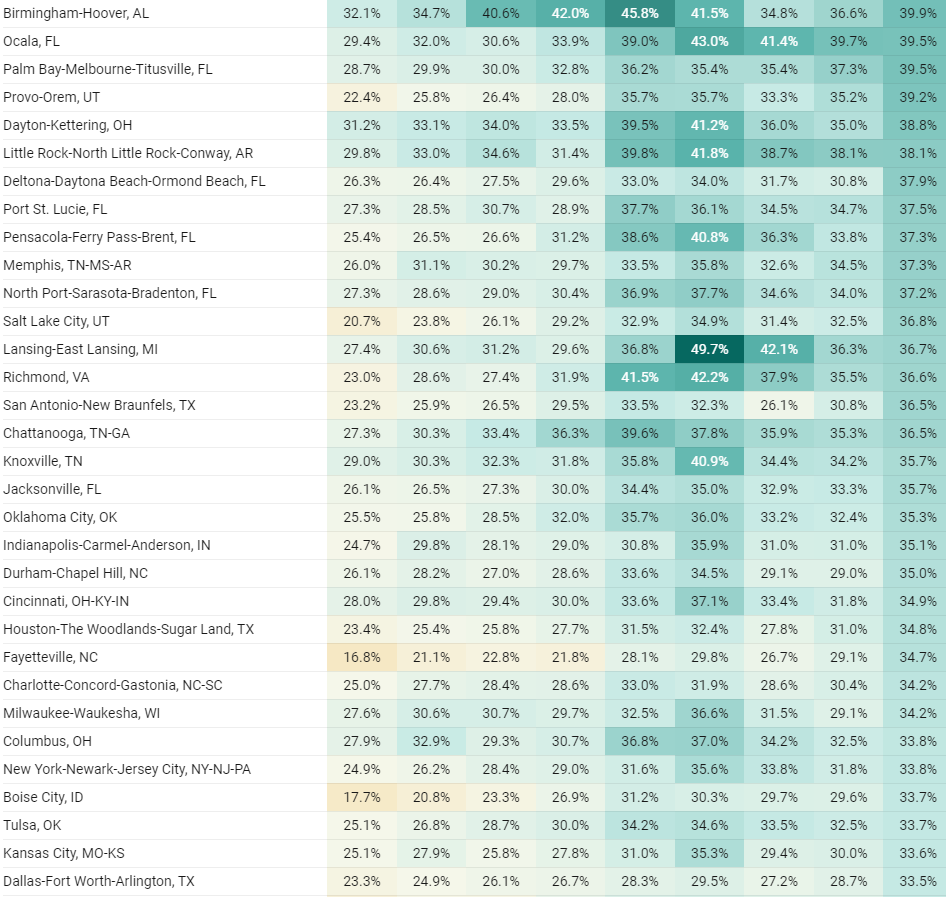
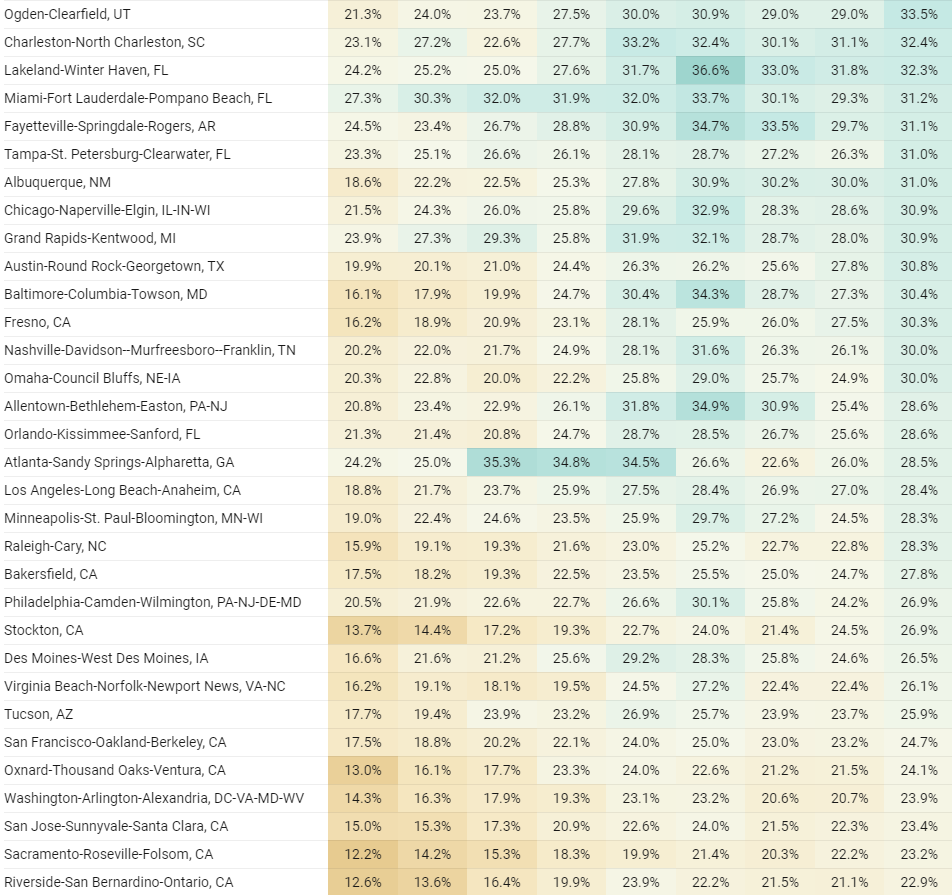
There have been 115 closings between La Jolla and Carlsbad this month, and 47% of them were all-cash. It’s the highest percentage we’ve seen so far, and it’s likely to continue.
Those who aren’t paying all-cash have big down payments to help cushion the higher rates. Payment too high? Put more down!
For the downsizers, it’s the best way to justify giving up the 3% mortgage too – sell the long-time family estate and buy the next one all-cash.
Last month’s 200 sales will probably be the highest monthly count we’ll see in 2024, so the market will have to endure less volume, and more listings sitting around unsold.
It means that the percentage of all-cash buys will probably be increasing. I think it could get up to 66% by the end of the year!
Here I talk about the current market conditions and how they relate to our new listing in NE Carlsbad. It’s a real mis-match too, with estate sales supplying much of the inventory when a majority of buyers want turnkey only.
Like last year, sales will probably fade away unless more sellers are so motivated that they adjust their price in time. The number of NSDCC active listings has stayed under 400 all year – until this week.
Today there are 421 active listings between La Jolla and Carlsbad. Last year the number of actives was only above 400 during a three-week stretch in July.
The locked-in effect has been bandied about for the last couple of years as the reason why the inventory remains thin. But it’s not stopping those who want to pay cash and avoid a mortgage altogether – every area is showing increases in the all-cash purchases.
If you don’t want to leave your local neighborhood, then yes, you’re locked in – the higher prices and rates make it prohibitive to move. But for the homeowners who don’t mind leaving town, they can take their winnings and pay cash for their next house!
Don’t let higher rates stop you. Thirty-eight percent of the homes in America are paid in full – join the club!