by Jim the Realtor | Mar 24, 2021 | 2021, Bidding Wars, Frenzy, Market Surge, Realtor |
To provide some transparency on the deal-making on the street, here’s a review of properties that have gone pending this week. I didn’t intend to make a blog post out of it, but I had inquired about the availability of these listings, and for my own knowledge I like to ask how many offers the listings agents have received.
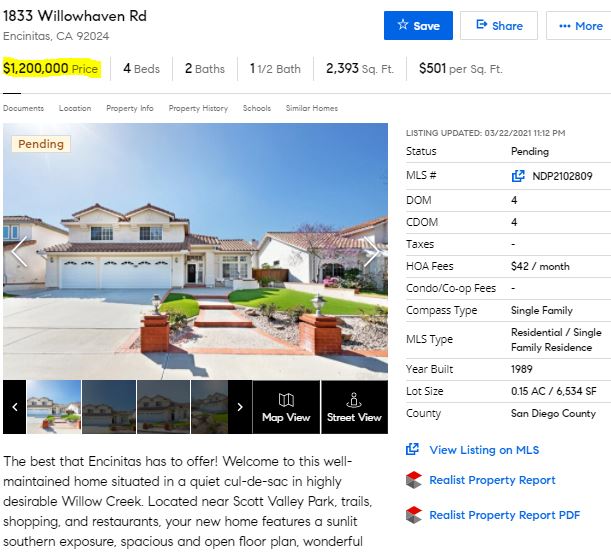
They had FIVE OFFERS on 1833 Willowhaven, and another similar home that listed on the same side of the street for $1,299,000 also had multiple offers. A good example of how a few more listings in the lower price ranges should all get picked up.
~~~~~~~~~~~~~~~~~~~~~~~~~~~~~~~~~~~~~~~~~~~~~~~~~~~~
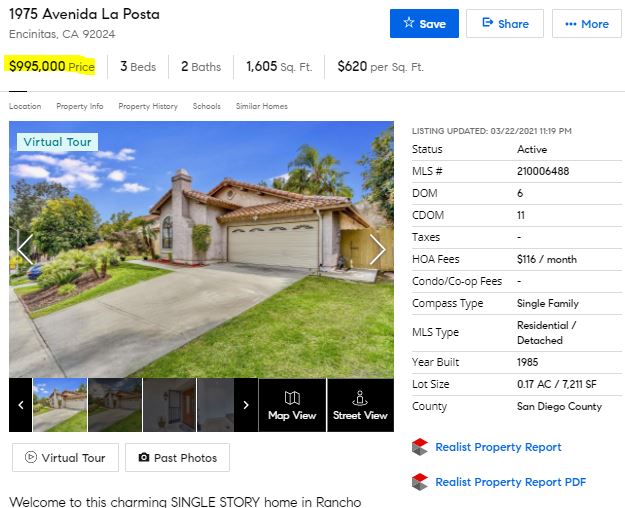
They had SEVEN OFFERS on this one. Any of the one-story homes listed under $1,000,000 should attract a crowd for the foreseeable future.
~~~~~~~~~~~~~~~~~~~~~~~~~~~~~~~~~~~~~~~~~~~~~~~~~~~~~
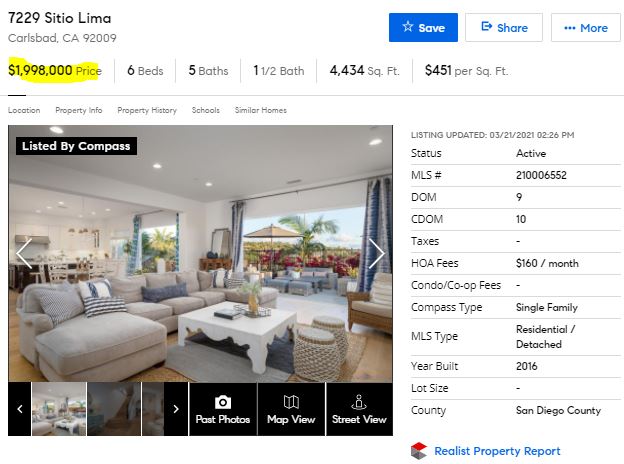
They had SIX OFFERS on this one. Newer Davidson homes are always going to be popular, and though the yard was brief, this has a pretty good view.
~~~~~~~~~~~~~~~~~~~~~~~~~~~~~~~~~~~~~~~~~~~~~~~~~~~
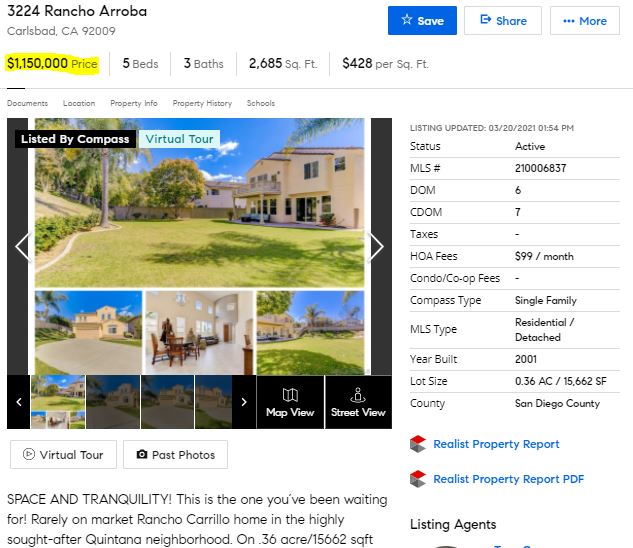
They had TEN OFFERS on this one, and you can see why. Houses on a culdesac with a backyard this big will draw a crowd in any market.
~~~~~~~~~~~~~~~~~~~~~~~~~~~~~~~~~~~~~~~~~~~~~~~~~~~
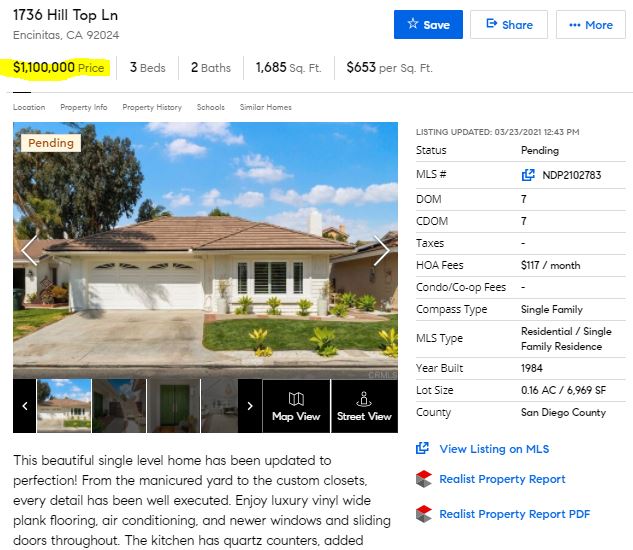
They had EIGHTEEN OFFERS on this one, because it checks most of the boxes. Well-priced single-level with nice private yard that’s been tastefully renovated. The 17 other buyers will be battling it out for months on these! I commend the listing agents for providing enough access to accommodate that many people and offers.
~~~~~~~~~~~~~~~~~~~~~~~~~~~~~~~~~~~~~~~~~~~~~~~~~~~
by Jim the Realtor | Mar 17, 2021 | 2021, Bidding Wars, Frenzy, Market Buzz, Market Surge

Hat tip to Ryan for his excellent job documenting the real estate frenzy underway in the Sacramento area:
http://sacramentoappraisalblog.com/
Susie says the Boise market is on fire, Noodle said that every house in North Phoenix sells in 3-4 days, home prices in Austin are similar to what they are here (according to one buyer) and even Kayla is seeing multiple offers again in Manhattan!
The potential sellers here who want to list their house for sale so they can leave the state have to be concerned about buying their replacement home, if they haven’t bought one yet.
How many will give up and say, “heck, it’s better here anyway”, and pack it in, instead?
Will a surge of supply over the next 3-4 months – when we need it the most – be stymied because of the difficulty with buying a home elsewhere?
As crazy as it is right now, it could get crazier! It probably will!
by Jim the Realtor | Mar 16, 2021 | Actives/Pendings, Market Conditions, Market Surge, North County Coastal, NSDCC Pendings

Previously we experienced a healthy market when actives outnumbered pendings 2:1. Then as the market heated up, we got used to the 1:1 ratio. Now we have areas where the ratio is more than 1:2!
NSDCC Detached-Home Active and Pending Listings
| Town or Area |
Zip Code |
Actives |
Pendings |
| Cardiff |
92007 |
10 |
14 |
| NW Carlsbad |
92008 |
15 |
24 |
| SE Carlsbad |
92009 |
20 |
48 |
| NE Carlsbad |
92010 |
4 |
11 |
| SW Carlsbad |
92011 |
4 |
19 |
| Carmel Valley |
92130 |
25 |
38 |
| Del Mar |
92014 |
32 |
25 |
| Encinitas |
92024 |
36 |
48 |
| La Jolla |
92037 |
95 |
45 |
| RSF |
67+91 |
87 |
50 |
| Solana Beach |
92075 |
8 |
9 |
| NSDCC |
All Above |
336 |
331 |
| West RB |
92127 |
24 |
63 |
| Scripps Ranch |
92131 |
6 |
25 |
What can buyers do?
Going inland doesn’t help – the 92127 and 92131 are hotter than ever.
Just go up in price – La Jolla is nice this time of year!
We will re-visit these numbers in the coming months.
by Jim the Realtor | Mar 14, 2021 | Market Surge

San Diego County has 3.338 million people, plus more affluence arriving daily.
There is 27.5% of the SDCo population that is under age 18.
3,338,000 x 72.5% x 7.6% = 183,923 millionaires in SD County!
You can imagine the horsepower that homebuyers are up against – millionaires trying to outdo millionaires!
- Credit Suisse’s latest global wealth report shows there are 46.8 million millionaires (measured in USD) worldwide.
- Of those, 40% or 18.6 million individuals are in the United States.
- This means that about 7.6% of the U.S. adult population are millionaires.
- Which indicates that approximately 14% of U.S. households are in the millionaire club
- With a median wealth of $65,904 for an adult in the U.S., $1,000,000 represents 1517% of the median.
- The annual increase in global wealth per adult was 2.6%.
- After the U.S at 40%, the next highest 5 countries for millionaires are China 10%, Japan 6%, United Kingdom 5%, Germany 5%, and France 4%.
- These top six countries represent 70% of the world’s millionaires.
- If you’re a millionaire, you are in the top 0.6% of wealth for the world’s population.
- The nine cities with the most millionaires, in decreasing order are Tokyo, New York City, London, Paris, Frankfurt, Beijing, Osaka, Hong Kong, and Shanghai.
https://millionairefoundry.com/millionaire-statistics/
by Jim the Realtor | Mar 10, 2021 | 2021, Bidding Wars, Frenzy, Jim's Take on the Market, Market Buzz, Market Surge, Spring Kick
I love hearing from new readers!
Hi Jim,
I have recently stumbled upon your blog and find it very interesting as I am an appraiser in San Diego. I wonder if anyone has considered that the low inventory levels are in part because home prices are going up so fast why would anyone want to sell something that is going to be worth 10K, 20K, 50K more within just months. For example my home according to Zillow is up 22K in the last 30 days. Something else to consider that I have not seen mentioned….
Are sellers paying attention that closely? If so, then you’re right – it’s possible. Add that extra supply to the post-covid/Prop-19/usual-spring listings and there could be a real surge. But the worst thing that will happen is there will be 3-4 houses for sale in your neighborhood, instead of one or two.
Do sellers risk it? Most are already making $200,000 to $1,000,000+ profit……are they going to purposely hold out in hopes of picking up an extra $50,000? Maybe, but I’d guess that when and where they are moving probably plays a bigger role in their decision-making.
~~~~~~~~~~~~~~~~~~~~~~~~~~~~~~~~~~~~~~
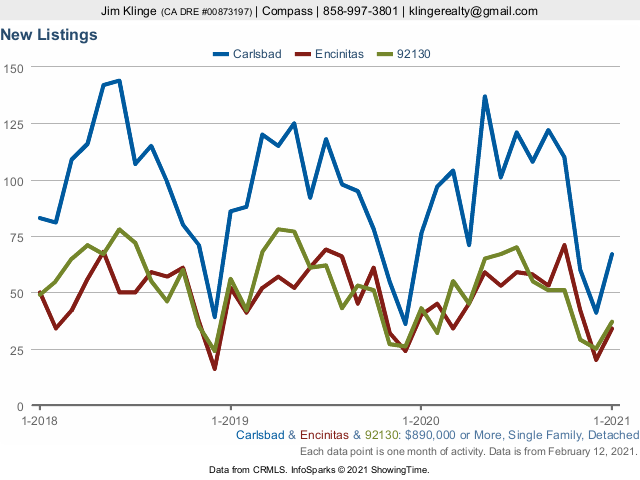
Sellers are indeed holding back for some reason.
In the first nine days of March last year we had 148 new listings between La Jolla and Carlsbad, and so far we’ve only had 90 this year. More will be added to that nine-day total this week, but we’re still well under where we’ve been in previous years. March is when the inventory really picks up, historically:
~~~~~~~~~~~~~~~~~~~~~~~~~~~~~~~~~~~~~~~~~~~~
The Frenzy of 2013 was red-hot for about a year. If the same happens this time, it means the market should flatten out by July as rates increase and buyer exhaustion sets in.
~~~~~~~~~~~~~~~~~~~~~~~~~~~~~~~~~~~~~~~~~~~~
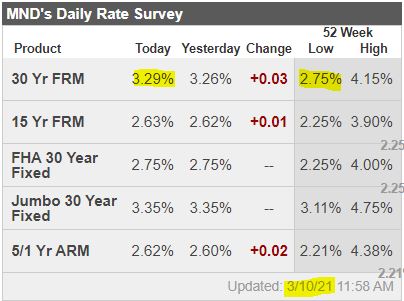
The bump in rates over the last two weeks just threw gasoline on the fire for those who could find a house to buy. But an extended run-up – especially if we get to 4% – should cool things off.
~~~~~~~~~~~~~~~~~~~~~~~~~~~~~~~~~~~~~~~~~~~~
I have two closings with buyers this week. One paid $135,000 over list, and the other paid $100,000 over.
~~~~~~~~~~~~~~~~~~~~~~~~~~~~~~~~~~~~~~~~~~~~
Over the weekend, I had buyers make a highest-and-best offer that was $207,000 over list….and lost.
~~~~~~~~~~~~~~~~~~~~~~~~~~~~~~~~~~~~~~~~~~~~
There is virtually no transparency – just take your shot and pray. Don’t think, and don’t blink!
~~~~~~~~~~~~~~~~~~~~~~~~~~~~~~~~~~~~~~~~~~~~
by Jim the Realtor | Feb 26, 2021 | 2021, Frenzy, Jim's Take on the Market, Market Buzz, Market Surge, Spring Kick, Why You Should Hire Jim as your Buyer's Agent, Why You Should List With Jim

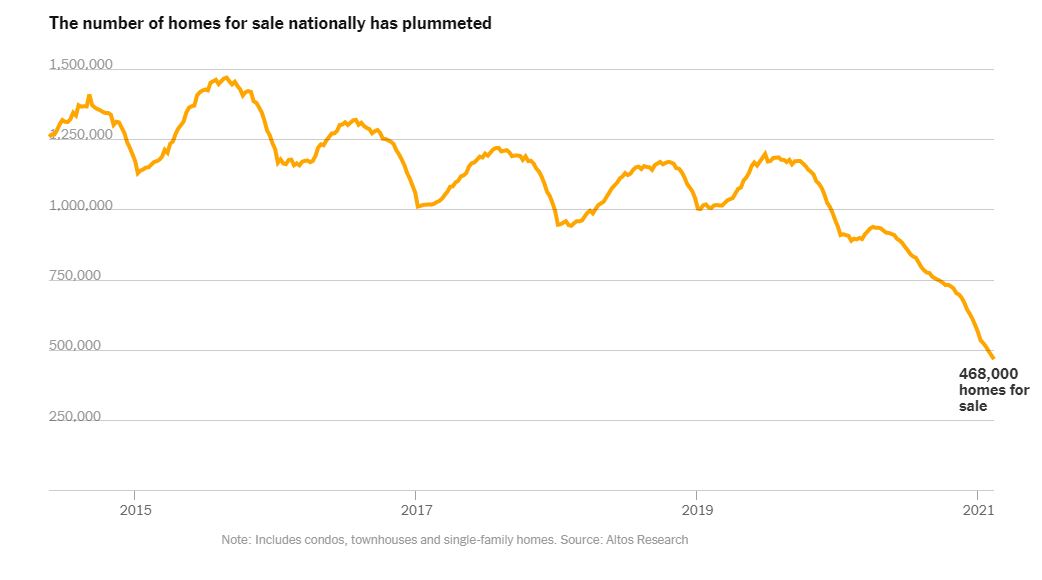
The NYT has another article lamenting the drop in the number of homes for sale, and offered some reasons, like covid reluctance, sellers skittish about finding their next home, forbearance relief, the lack of building new homes, and people keeping their old home as an investment property when they buy a new one.
But who cares about inventory when we’re having MORE SALES THAN EVER.
It’s true that the number of new listings this year is about 23% behind where it was last year at this time.
The other day I compared just to 2020, but here’s a look at the last ten years:
NSDCC Closed Sales Jan 1 – Feb 15
| Year |
# of Sales |
Median Sales Price |
| 2011 |
158 |
$810,500 |
| 2012 |
153 |
$749,000 |
| 2013 |
197 |
$845,000 |
| 2014 |
261 |
$1,007,500 |
| 2015 |
252 |
$1,200,000 |
| 2016 |
253 |
$1,125,000 |
| 2017 |
260 |
$1,200,000 |
| 2018 |
231 |
$1,300,000 |
| 2019 |
242 |
$1,288,000 |
| 2020 |
254 |
$1,394,775 |
| 2021 |
299 |
$1,695,000 |
| % Change, YoY |
+18% |
+22% |
We haven’t had this big of a jump in number of sales AND median sales price to start the year since the Frenzy of 2013 bled into early 2014 when we had a 32% increase in sales and +19% in median sales price. Back in 2004, we had a 26% increase in the median sales price (from $635,000 to $799,000), but the number of sales dropped from 253 to 209.
This is the new reality – more people chasing fewer homes for sale.
Buyers who might think we’re going to get a pullback because rates have gone up are going to get a good lesson on who’s in charge here. Sellers don’t care about rate hikes, lack of inventory, or your lease expiring. They just want their money, and if they don’t get it today, they will wait until they do.
~~~~~~~~~~~~~~~~~~~~~~~~~~~~~~~~~~~~~
by Jim the Realtor | Feb 23, 2021 | Actives/Pendings, Jim's Take on the Market, Market Buzz, Market Conditions, Market Surge, North County Coastal, NSDCC Pendings, Spring Kick |
This morning we have more homes in escrow than we have for sale!
NSDCC Detached-Home Listings
| Listing Status |
# of Listings |
Median List Price |
| Active |
352 |
$3,950,000 |
| Pending |
353 |
$1,925,000 |
Once upon a time I was discussing the actives/pendings relationship with local agent Peter B. He agreed that a 2:1 ratio of actives to pendings was a sign of a healthy market. If 2:1 was healthy, what is 1:1?
One thing that’s happening is that the action is rising into the upper price ranges. Today we have 94 homes in escrow that are priced over $3,000,000, which I doubt we’ve ever had before.
If we don’t see a surge of more listings, the pendings could extend its lead in the coming days/weeks!
~~~~~~~~~~~~~~~~~~~~~~~~~~~~~~~~~~~~
by Jim the Realtor | Feb 20, 2021 | Market Conditions, Market Surge
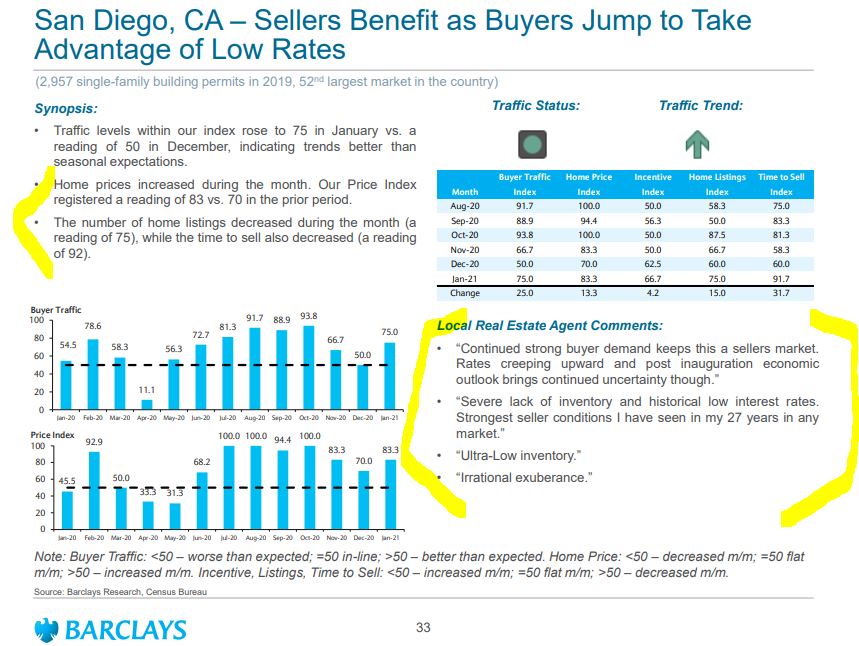
I think we can say that February has been at least as hot as January! It may be irrational exuberance, but it’s going to continue until there is significant boost in supply.
~~~~~~~~~~~~~~~~~~~~~~~~~~~~~~~
by Jim the Realtor | Feb 18, 2021 | Market Surge, North County Coastal, Spring Kick

Are we getting any more inventory? Are more homes coming to market?
There have been a few more good listings, which gives hope. The Super Bowl being on February 7th was later than usual, but the overall numbers are still very light:
NSDCC New Listings Between Feb 1 – Feb 15
| Year |
Total Number of Listings |
Median List Price |
Number Under $2M |
Total Sold |
% Sold |
| 2019 |
207 |
$1,650,000 |
135 |
132 |
64% |
| 2020 |
208 |
$1,731,500 |
126 |
121 |
58% |
| 2021 |
140 |
$1,776,500 |
85 |
? |
? |
The 2021 count will climb a bit higher, but it’s safe to say that we are still well behind where we usually are.
If we end up around 165 listings, and the percentage sold improves to 70%, it would equal 116 sales which is close to the 2020 total.
If all we are missing are the casual sellers that wouldn’t have sold anyway, are we any worse off?
Not really – and the market would be more efficient if we’re just left with the serious players all around.
by Jim the Realtor | Feb 12, 2021 | Actives/Pendings, Market Surge, North County Coastal, NSDCC Pendings |
When you look at the general data, the 25% dip year-over-year of January listings doesn’t look so bad – especially on a graph. Heck, we’re in the middle of a pandemic!
But look how it is playing out:
NSDCC Detached-Home New Listings
| Price Range |
New Listings in January |
# of Those Pend/Sold |
Pend/Sold Median DOM |
| Under $1.5M |
85 |
75 |
5 |
| Over $1.5M |
189 |
98 |
6 |
The lower-end is smoking hot where virtually all listings have found a buyer (88%), and for the higher-end to have most of the January listings go pending already is astonishing!
This has to be the best performing market of all-time!
~~~~~~~~~~~~~~~~~~~~