by Jim the Realtor | Mar 16, 2023 | 2023, Frenzy, Frenzy Monitor, Jim's Take on the Market, North County Coastal
The reason for breaking down the active and pending listings by zip code is to give the readers a closer look at their neighborhood stats.
Four areas have MORE pendings than active listings, which is a sign of a red-hot market, and all areas except Rancho Santa Fe are around the healthy 2:1 ratio. But the most interesting datapoint is how the number of active listings has been skidding downward ever since rates went up:
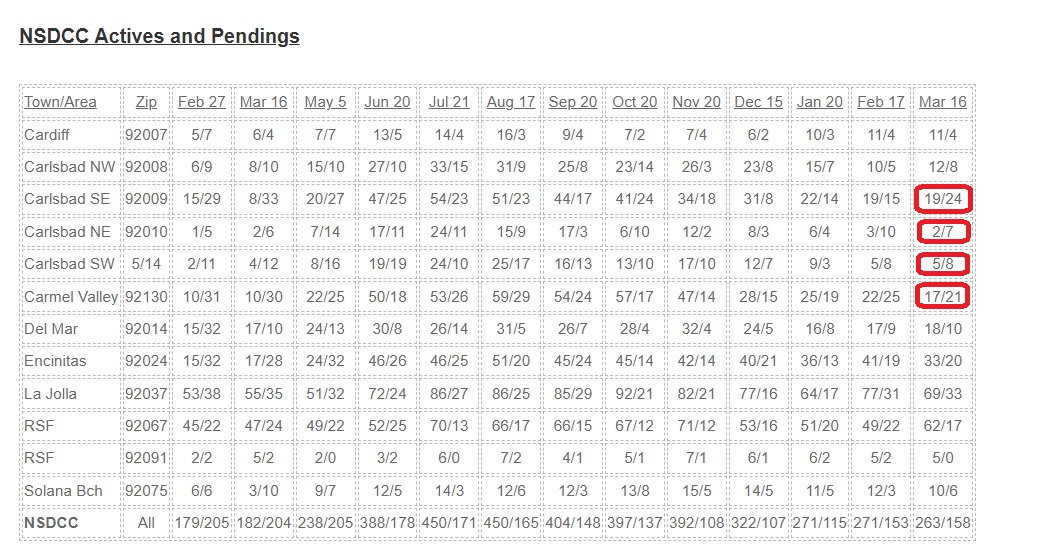
The demand may have dropped off, but the supply is shrinking just as fast, or faster. Virtually everyone who is thinking about selling their house this year is going to be on the market in the next 2-3 months, and so far, it doesn’t look like the number of springtime sellers will be anywhere close to what we’ve had in the past.
The number of 2023 NSDCC listings is already 20% behind last year’s count – which was the lowest ever.
by Jim the Realtor | Mar 14, 2023 | Jim's Take on the Market, North County Coastal, Sales and Price Check |
When it comes to anticipating the direction of the real estate market, the median pricing isn’t nearly as informative as these indicators – Number of Sales and SP:LP.
We are used to seeing the sales increase early in the year, but it could have been different if higher rates had broken the market. But it looks like we’re going to survive, especially when you see the SP:LP rising:
NSDCC Monthly Sales
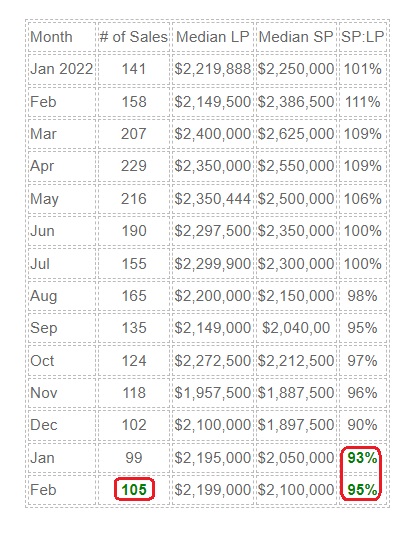
Last February, March, and April were scorching hot, and the market’s about-face in the second half of 2022 looks very orderly, in hindsight. Both the number of sales and SP:LP ratios were declining until recently, and now they make the rest of spring look promising.
by Jim the Realtor | Mar 3, 2023 | Jim's Take on the Market, North County Coastal, Sales and Price Check |
Combining the January and February stats gives us the larger sample sizes to better identify the trends.
The sellers are doing a phenomenal job at restricting the supply, and there have been enough buyers to keep the momentum going. The current listings/sales ratio is better than it was in the years before the frenzy, in spite of much higher pricing. Compare today’s pricing to 2021:

There were 78 of the 201 sales that were all-cash (39%).
It would help if there was more innovation in the mortgage world. You can get a 5-year fixed jumbo at 5.625% today, but with everyone buying their forever home, how many will want short-term money?
Without creative financing or lower rates, we will likely be on a long bumpy road for years to come.
by Jim the Realtor | Mar 1, 2023 | 2023, Frenzy, Market Conditions, Monthly Sales Count, North County Coastal
It was the most insane frenzy ever, and it was the most intense at the beginning of last year as inventory started to thin out. Compared to that environment, I think these stats look pretty good:
NSDCC Monthly Sales and Pricing
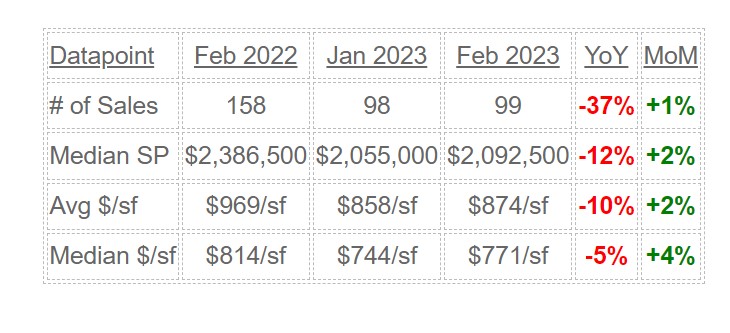
Down 5% to 10% YoY, and on the rise? I’ll take it!
by Jim the Realtor | Feb 24, 2023 | 2023, North County Coastal, Sales and Price Check |
We have an unusual obsession with home pricing – I say unusual because nobody cares that our measuring devices are deeply flawed and regularly give the wrong impression. With the stakes being so high, you’d think homebuyers would investigate thoroughly – but everyone just wants to grab and go!
You can see in the graph above how the smaller sample sizes cause more volatility – Encinitas only had 19 houses sold in December, and ten closings in January – so the 10% to 15% bounces up and down aren’t good representations of the pricing trend.
This is a better look at the trend – the average and median $$/sf for houses sold between La Jolla and Carlsbad, and this includes the 70 sales so far this month:

The upward trend should continue as more of the premium products come to market this spring.
I predicted that there wouldn’t be a sale under $2,000,000 in the Davidson Starboard tract in La Costa Oaks after we closed the Plan 2 in October. The first new listing there since is coming soon, priced at $2,899,000 and they should get all the money:
https://www.compass.com/app/listing/7657-sitio-algodon-carlsbad-ca-92009/1253018741329889369
I know they paid $1,999,919 in 2019, but there have been others that have closed for a million dollars over their 2019 purchase price. The Plan 3 layout probably isn’t as popular as the Plan 2, and the backyard is filled with a pool. But this street is a culdesac and it has the best south and west views which only come up occasionally for sale. It’s been so long since we’ve had an offering like this that I wouldn’t be surprised if she has 100+ people look at it next week – in spite of all the doom!
by Jim the Realtor | Feb 22, 2023 | Inventory, Jim's Take on the Market, North County Coastal |

Remember when the inventory tanked in 2020 when everyone was afraid of catching the bug?
Once the pandemic was over, we’d get back to the regular flow of homes for sale, wouldn’t we?
But the intensity seemed to increase as time went on, finally spinning out of control when mortgage rates went up. The resulting debris field is causing fewer people to want, or need, to sell.
For most, staying put seems like the best option, at least for now.
Buyers can probably endure another year on the lease. But potential sellers are getting closer and closer to being too old to move. If there isn’t a clear path to living for another 5-10 years (and hopefully longer) in your new town, you’re probably going to decide to live it out where you are.

The NSDCC YoY change in January was only -17%, so only half as bad as San Diego in general. But the first 15 days of February are -20% YoY, so the local inventory isn’t exactly getting better.
The drop from 2019 is 55%!
by Jim the Realtor | Feb 21, 2023 | 2023, Jim's Take on the Market, North County Coastal
Let’s revisit yesterday’s graph and add the sales to compare the relative health of the market.
If higher mortgage rates were stopping home buyers, then sales would plummet, especially in relation to the number of listings. But if the number of listings plummets too, and we’re down to just the most serious buyers and sellers, we can still have an orderly market:
NSDCC Listings and Sales Between Jan 1 and Feb 15
| Year |
Number of Listings |
Number of Sales |
Listings/Sales |
| 2019 |
625 |
239 |
2.6 |
| 2020 |
563 |
253 |
2.2 |
| 2021 |
449 |
290 |
1.5 |
| 2022 |
341 |
226 |
1.5 |
| 2023 |
280 |
148 |
1.9 |
The local market isn’t in shambles or falling apart.
The number of buyers AND sellers are much lower than they were previously, but they are acting in concert and fairly similar to the frenzy years. By the time the late-reporters log in, this year’s L/S will get down to 1.8 or 1.7 which is remarkably similar to the hottest frenzy years of all-time!
by Jim the Realtor | Feb 14, 2023 | Bubbleinfo Readers, Contests, North County Coastal, Padres |
There were 182 NSDCC listings in January, as of today – which means we have a clear winner, even if a few more listings get added by late-reporters.
Congratulations Rob Dawg!
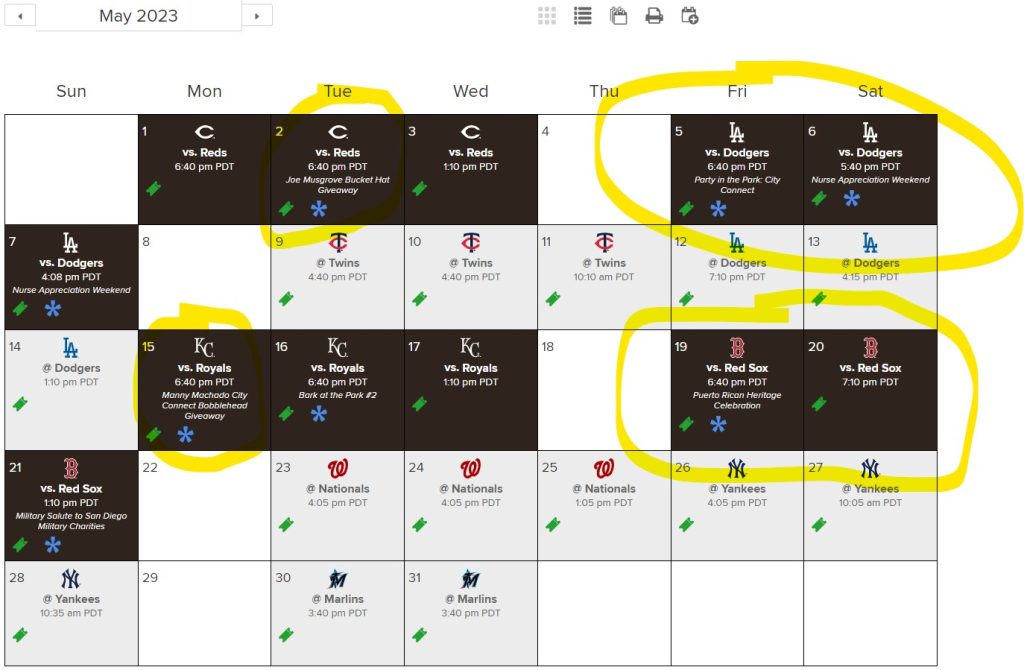
The season starts on March 30th, and May looks like a great month to attend a game. What might be the two best giveaways of the season (vs. the Reds and the Royals) happen that month, plus the Dodgers make their first visit back to Petco Park.
Dawg’s favorite team, the Red Sox, also return in May!
The summary of guesses, with some additions from the FB page:
16 Noodle
89 Momento
99 Tom
104 BWell_SoCal
111 Majeed
115 Lifeisradincbad
117 Susie
119 Beachside
120 Curtis
128 Joe
130 Rob
136 Skip
140 Haile
142 MC
146 Derek
152 Drew
158 Susan
160 doughboy
165 Kingside
174 SurfRider
175 Sciguy
186 Rob Dawg
190 Bode
200 Jeff Campbell
203 Lauren Stickelman
213 Shadash
252 Aunt Nancy
262 Eddie89
298 Nick
333 Sherman Messing
149 Median
This was the first time that the actual count of January listings landed in the upper third of the guesses. But don’t get giddy about the inventory just yet – here’s how it compares:
NSDCC January Listings:
2018: 426
2019: 418
2020: 354
2021: 289
2022: 223
2023: 182
The lack of choices is what causes hyper-frenzy conditions – it causes buyers to freak out. When a top-quality listing hits the market, buyers feel like this might be their only chance this month, or this year, to buy such a good match to their needs – and then the lack of transparency makes them go nuts.
It’s going to be a wild and crazy season – and not just for the Padres!

by Jim the Realtor | Feb 13, 2023 | 2023, North County Coastal, Spring Kick |

When mortgage rates started going up last year, I said all we have to do is survive until springtime – and it looks like we’ve made it!
Not only did our local market not crash and burn, it held up pretty well – and that’s in spite of the higher rates and blistering doomer attack over the last eight months.
The San Diego Case-Shiller NSA stats:
Mar 2020: 268.19
May 2022: 421.29 (+57%)
Nov 2022: 390.22 (-7%)
I don’t know where the -7% is happening, but around the NSDCC, the pricing hasn’t changed much.
The spring season should run hot through May, and by then the mortgage rates AND prices will probably be higher. The second half of 2023 will likely be sluggish, at best.
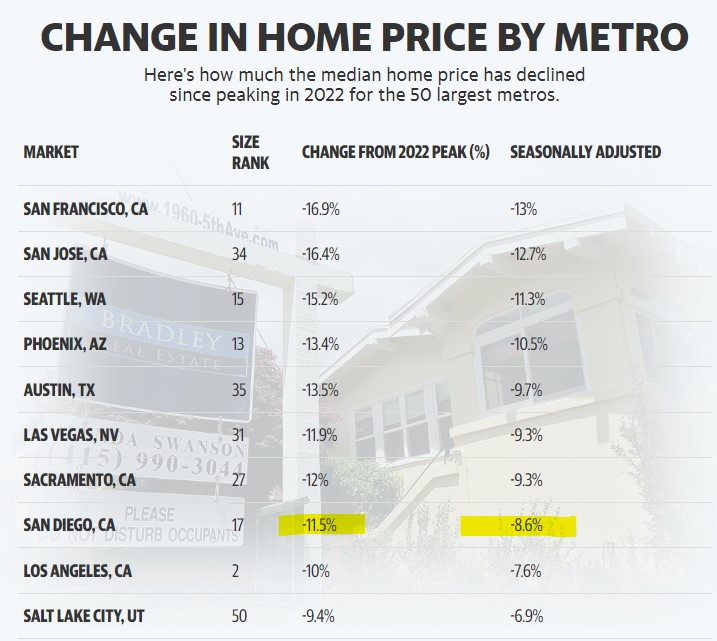
https://finance.yahoo.com/news/map-heres-where-home-prices-are-dropping-the-most-165428216.html
by Jim the Realtor | Jan 27, 2023 | Jim's Take on the Market, North County Coastal, Sales and Price Check |
I was confident that in the last few months of 2022 we would reach at least 100 detached-home sales between Carlsbad and La Jolla. We are up to 102 in December, after closing 118 in November!
I wasn’t so hopeful about January.
As of today, there have been 68 closings this month.
We could have more sales, because there are 269 active listings sitting around. But only those that deserve it (those that do everything right) will be selling now.
Those that get it right are being rewarded…..they are selling! You could say that pricing is on an upward trend too, if you rely on the lame and inadequate median sales price to guide your decisions:
NSDCC Monthly Sales and Pricing
| Month |
# of Sales |
Average SP |
Avg. SF |
Median SP |
Med. SF |
| November |
118 |
$2,447,009 |
3,094sf |
$1,887,500 |
2,647sf |
| December |
102 |
$2,682,523 |
3,064sf |
$1,897,500 |
2,596sf |
| January |
68 (so far) |
$3,206,653 |
3,646sf |
$2,222,500 |
2,833sf |
| Dec-Jan MoM Diff |
-33% |
+20% |
+19% |
+17% |
+9% |
Unfortunately, the dated and backward-looking Case-Shiller Index comes out next Tuesday, and the doomers will use it to convince you that the market is coming apart.
But because sellers are holding out, only the homes that deserve to sell will be closing in 2023, and they should get pretty close to what they want, price-wise. Except those represented by desperate agents who fail miserably at doing everything right, and then take a lowball offer.
With the lower number of sales, don’t be surprised if the median sales price fluctuates wildly.
Here are Bill’s thoughts on sales and pricing:
https://calculatedrisk.substack.com/p/has-housing-bottomed


