by Jim the Realtor | May 14, 2020 | Actives/Pendings, Jim's Take on the Market, North County Coastal, NSDCC Pendings, Psycho-babble, Realtor Training, Thinking of Buying?, Thinking of Selling?, Virus |
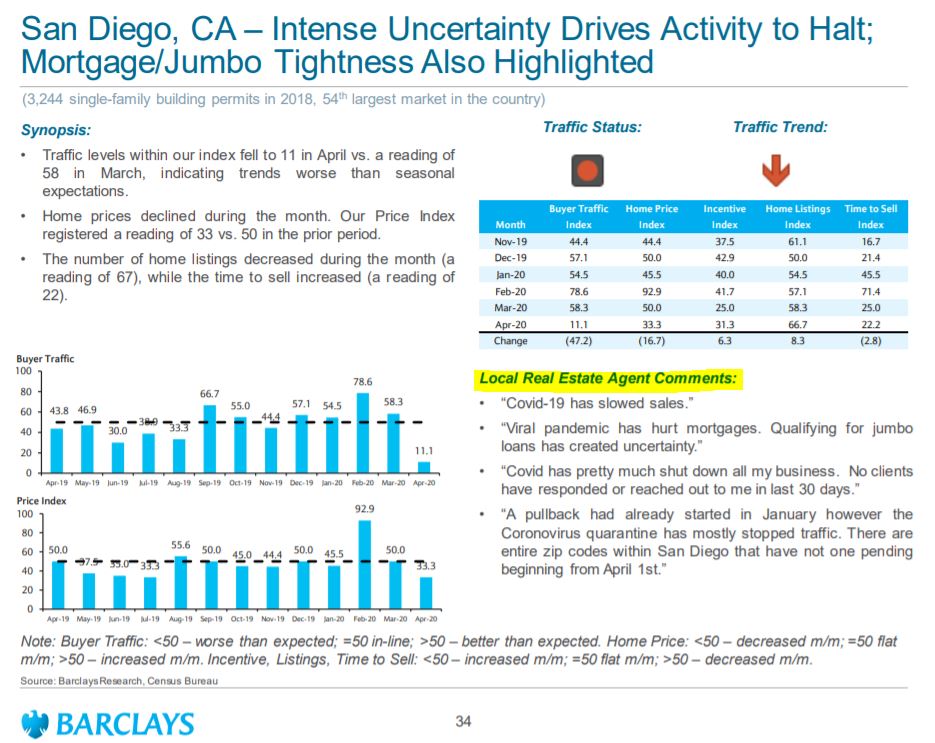
They send out this survey twice each month – on the 15th and 21st – so these agent comments above were based on their market observations around then. Hopefully they have gotten back to work by now:
| Town |
Zip Code |
New Listings Since April 1st |
New Pendings Since April 1st |
| Cardiff |
92007 |
18 |
3 |
| Cbad NW |
92008 |
25 |
15 |
| Cbad SE |
92009 |
63 |
36 |
| Cbad NE |
92010 |
18 |
15 |
| Carlsbad SW |
92011 |
47 |
20 |
| Carmel Vly |
92130 |
79 |
50 |
| Del Mar |
92014 |
28 |
10 |
| Encinitas |
92024 |
71 |
38 |
| La Jolla |
92037 |
60 |
16 |
| RSF |
92067 |
38 |
15 |
| Solana Bch |
92075 |
13 |
2 |
| NSDCC |
Totals |
460 |
220 |
We have had 220 new pendings since April 1st, which is remarkable! The 220 is today’s number, of which 47 have already closed. Others that went pending and fell out of escrow are not included.
by Jim the Realtor | May 1, 2020 | Jim's Take on the Market, NSDCC Pendings, Virus
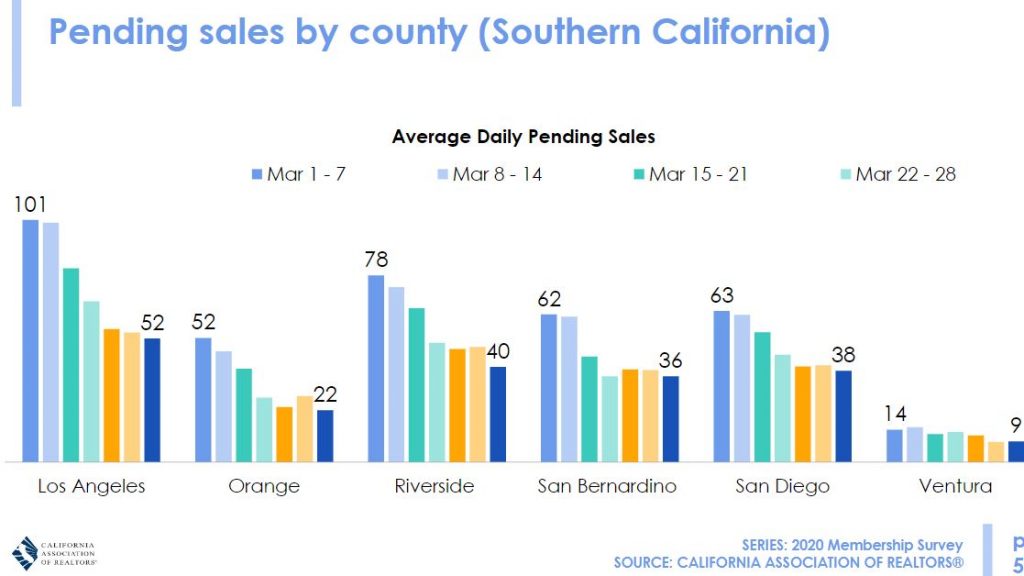
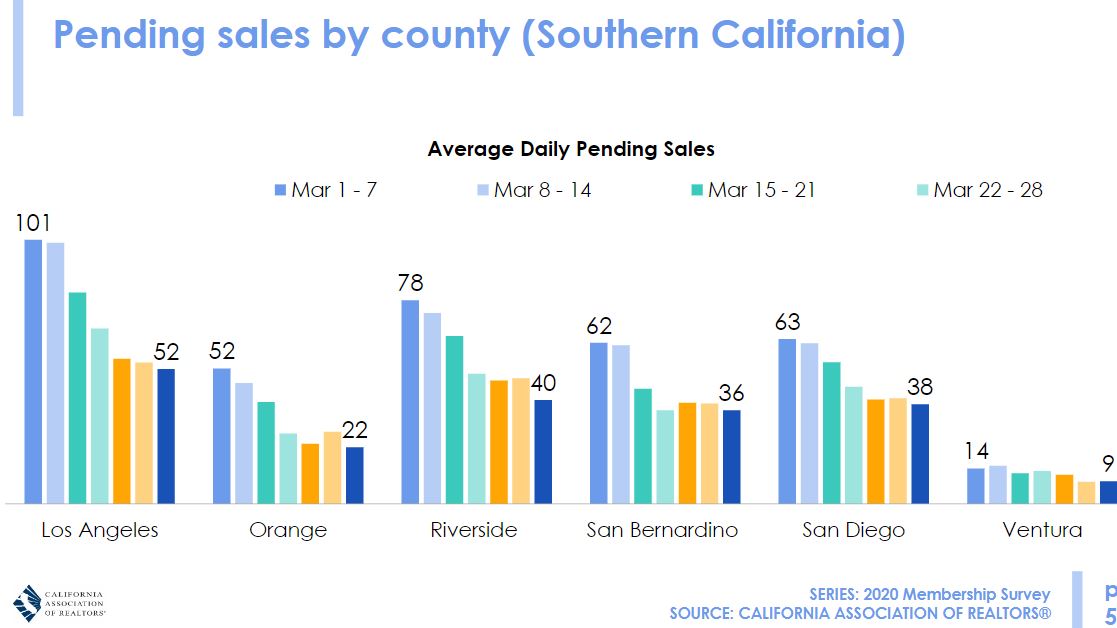
Yesterday we saw that our NSDCC sales for April should be down about 40% year-over-year, and the graph above shows about the same for average daily pending sales in San Diego County.
With pendings down 40%, and deals closing harder, it probably means that the YoY decline in May sales will be 50% or more.
We were going to have to live with fewer sales at some point – and it’s here!
CAR Market Update April 22 2020
by Jim the Realtor | Mar 21, 2020 | Jim's Take on the Market, Market Buzz, North County Coastal, NSDCC Pendings
This looks like just another Friday’s worth of activity!
We have 29 new pendings since Monday, so we’ll be a bit short of the typical 40-60 this week.
The C.A.R. issued a directive today, and this should shut down regular operations:
https://www.carcovidupdates.org/stay-at-home-guidelines
Unless we get creative!
by Jim the Realtor | Feb 18, 2020 | Jim's Take on the Market, North County Coastal, NSDCC Pendings, Sales and Price Check |
Our January sales count of detached-homes between La Jolla and Carlsbad was impressive, and comparable to the good old days!
NSDCC January Sales & Listings
| Year |
# of Sales |
Median SP |
Avg. Cost-per-sf |
# of New Jan. Listings |
| 2013 |
185 |
$845,000 |
$379/sf |
410 |
| 2014 |
182 |
$1,072,500 |
$501/sf |
413 |
| 2015 |
166 |
$1,221,500 |
$511/sf |
405 |
| 2016 |
171 |
$1,092,000 |
$553/sf |
471 |
| 2017 |
175 |
$1,180,000 |
$518/sf |
394 |
| 2018 |
151 |
$1,320,000 |
$573/sf |
426 |
| 2019 |
152 |
$1,300,000 |
$532/sf |
419 |
| 2020 |
183 |
$1,430,000 |
$607/sf |
339 |
In spite of all-time record pricing, the number of January listings really dried up, compared to previous Januarys – and 40% of last month’s listings are already pending or sold. How you feel about the inventory shortage depends somewhat on your price range too – here is the recent history:
NSDCC Number of January Listings by Price Range
| Year |
# Under-$1M |
$1M – $2M |
$2M – $3M |
Over $3M |
| 2013 |
186 |
123 |
50 |
56 |
| 2014 |
159 |
150 |
56 |
57 |
| 2015 |
138 |
162 |
50 |
62 |
| 2016 |
128 |
205 |
85 |
70 |
| 2017 |
101 |
163 |
71 |
71 |
| 2018 |
69 |
206 |
86 |
69 |
| 2019 |
74 |
201 |
66 |
85 |
| 2020 |
45 |
157 |
74 |
73 |
For those hoping to buy a house priced under a million, the dwindling number of listings is daunting. But the inventory over $1,000,000 has been relatively stable – no big surge there.
by Jim the Realtor | Sep 25, 2019 | Jim's Take on the Market, Market Conditions, Market Surge, North County Coastal, NSDCC Pendings, Sales and Price Check |
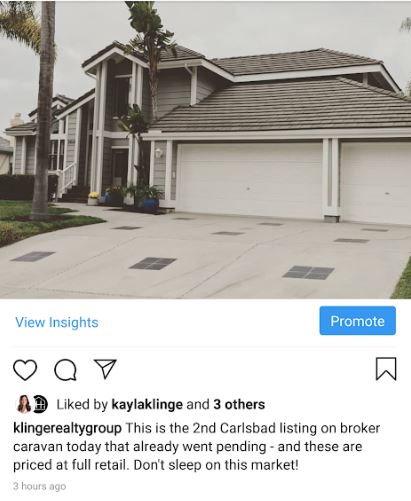
I noted on Instagram today that a couple of new listings in Carlsbad went pending before they got to broker preview today. While the sales and pricing statistics may look flat, sellers shouldn’t give up on selling when rates are still in the 3s.
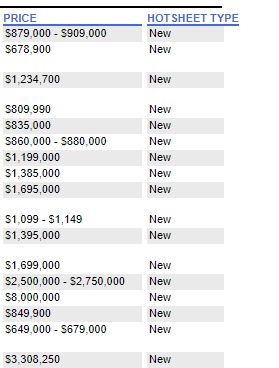
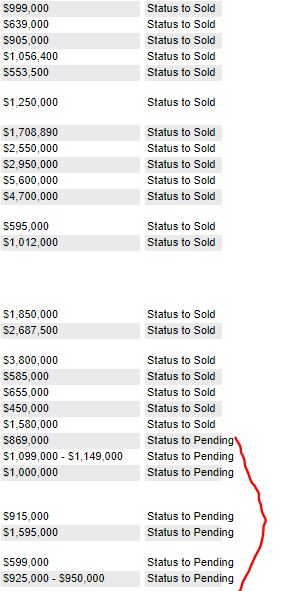
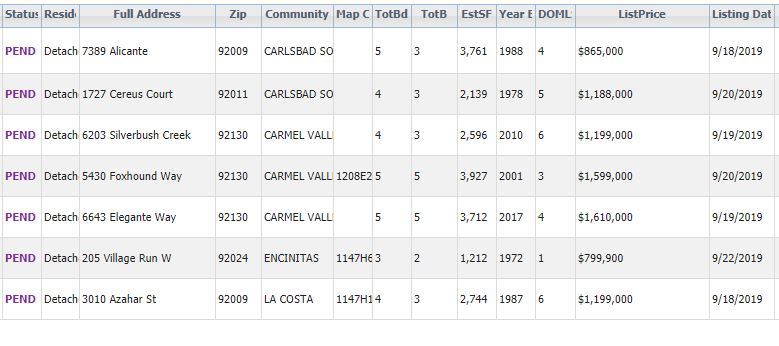
These are the listings from the last seven days that already found a buyer – these aren’t giveaways:
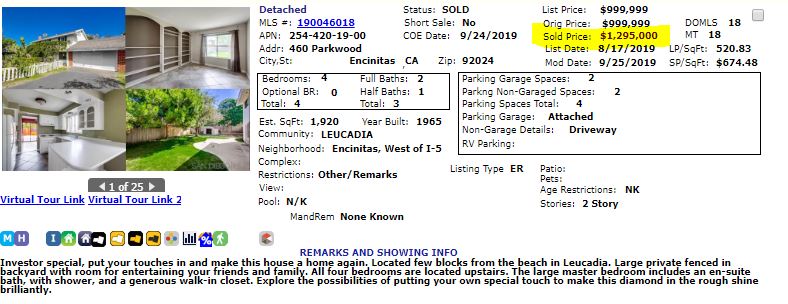
The big bidding war in Leucadia also closed…..at a whopping 30% over list price – in this market!
Wait…at your peril!
by Jim the Realtor | Apr 2, 2019 | Jim's Take on the Market, North County Coastal, NSDCC Pendings, Sales and Price Check

The NSDCC closed sales got off to a hot start in 2019!
But by March 4th, pendings had stalled and were 19% under last year’s total. Now that stall pattern is playing out in the March closings too:
NSDCC Detached-Home Sales, Year-Over-Year Changes:
| Year |
2018 |
2019 |
% chg |
| January |
151 |
151 |
-0- |
| February |
164 |
174 |
+6% |
| March |
259 |
203 |
-22% |
But the recent flurry of activity has us catching up. The pendings count today is only six behind the count on April 2nd of last year (340 vs 346).
The published March sales counts are going to be disappointing, even if we have a bunch of late-reporters. But the April/May sales should be healthier!
by Jim the Realtor | Mar 1, 2019 | Jim's Take on the Market, North County Coastal, NSDCC Pendings, Sales and Price Check, Spring Kick |
It’s March! How are we doing?
We’ve considered a 2:1 ratio of active-to-pending listings to be a sign of a healthy market. Though pricing is much higher than in the recent past, we’re under 3.0 is all but the highest-end areas:
Here are the Actives/Pendings stats for each area:
| Area |
Zip |
ACTIVES |
PENDINGS |
ACT/PEND |
SOLDS Last 30 days |
| Cardiff |
92007 |
21 |
11 |
1.9 |
3 |
| Carlsbad NW |
92008 |
42 |
15 |
2.8 |
12 |
| Carlsbad SE |
92009 |
72 |
38 |
1.9 |
29 |
| Carlsbad NE |
92010 |
25 |
11 |
2.3 |
12 |
| Carlsbad SW |
92011 |
41 |
27 |
1.5 |
18 |
| Del Mar |
92014 |
78 |
18 |
4.3 |
9 |
| Encinitas |
92024 |
74 |
43 |
1.7 |
23 |
| La Jolla |
92037 |
171 |
32 |
5.3 |
18 |
| RSF |
67+91 |
179 |
23 |
7.8 |
8 |
| Solana Bch |
92075 |
25 |
6 |
4.2 |
5 |
| Carmel Vly |
92130 |
80 |
37 |
2.2 |
31 |
| All Above |
All |
808 |
261 |
3.1 |
168 |
The first half of 2018 was very active, so just to stay close would be a win.
Sales in January caught up with last year’s count, and the year-over-year February sales are stronger than expected too – we had MORE sales in 2019! (updated later on March 1st)
NSDCC Closed Sales:
| Year |
January |
February |
Median SP YTD |
Avg $$/sf YTD |
| 2018 |
150 |
164 |
$1,294,005 |
$573/sf |
| 2019 |
150 |
165 |
$1,275,000 |
$540/sf |
Pricing is soft, but close enough for now.
by Jim the Realtor | Feb 25, 2019 | Actives/Pendings, Contests, Inventory, Jim's Take on the Market, NSDCC Pendings |

Thanks Rob Dawg for the gift!
Our contest for Padres tickets got more exciting this week due to Manny Mania!
NSDCC New Listings Jan 1 to Feb 20:
2018: 681
2019: 644 (-5%)
The two-month total last year was 783, so we’re on a pace to hit 741. Doughboy guessed 740, but it came in after the guessing period ended. If he wins, I’ll give tickets to him and the next closest guesser.
Others who guessed under 800:
755 – Neil
777 – Bb
785 – Recordsclerk
799 – TominLaCosta
We finally hit a statistical oddity that we’ve been flirting with for months. The average list-price-per-sf of the Under-$1,000,000 category caught up with the next category, $1.0M to $1.5M.
Both are at $494/sf today!
There was another quirk also. The new listings AND the new pendings both dropped off over the past week, which is unusual for this time of year. It must have been due to the rain?
The total number of pendings today is 18% behind last year.
Looking ahead to next month? It starts Friday! We had 446 new listings in March of last year, which was 25% more than in February, 2018.
(more…)
by Jim the Realtor | Feb 21, 2019 | Jim's Take on the Market, North County Coastal, NSDCC Pendings, Sales and Price Check |

Yesterday, the C.A.R. released the statewide January results, with more speculation from our so-called leaders:
California home sales fall to lowest level in more than 10 years
– Existing, single-family home sales totaled 357,730 in January on a seasonally adjusted annualized rate, down 3.9 percent from December and down 12.6 percent from January 2018.
– January’s statewide median home price was $538,690, down 3.4 percent from December and up 2.1 percent from January 2018.
– Statewide active listings rose for the 10th straight month, increasing 27 percent from the previous year.
– The statewide Unsold Inventory Index was 4.6 months in January, up from 3.5 months in December.
“California continued to move toward a more balanced market as we see buyers having greater negotiating power and sellers making concessions to get their homes sold as inventory grows,” said C.A.R. President Jared Martin. “While interest rates have dropped down to the lowest point in 10 months, potential buyers are putting their homeownership plans on hold as they wait out further price adjustments.”
The statewide median home price declined to $538,690 in January. The January statewide median price was down 3.4 percent from $557,600 in December and up 2.1 percent from a revised $527,780 in January 2018.
“While we expected the federal government shutdown during most of January to temporarily interrupt closings because of a delay in loan approvals and income verifications, the impact on January’s home sales was minimal,” said C.A.R. Senior Vice President and Chief Economist Leslie Appleton-Young. “The decline in sales was more indicative of demand side issues and was broad and across all price categories and regions of the state. Moreover, growing inventory over the past few months has not translated into more sales.”
Link to press release
Obviously, they haven’t done a survey of the North San Diego County’s coastal region! Between La Jolla and Carlsbad, we had about the same number of January sales last month as we did in January, 2018, so we’re faring much better than the -12.6% statewide. We are further into February so let’s pick up the sales from the first half, and break it down by price category too:
NSDCC Detached-Home Closed Sales, Jan 1 to Feb. 15th
| Price Range |
2014 |
2015 |
2016 |
2017 |
2018 |
2019 |
PEND |
ACT |
| Under $1M |
129 |
96 |
107 |
93 |
71 |
65 |
76 |
64 |
| $1M to $1.5M |
62 |
71 |
82 |
88 |
77 |
91 |
87 |
163 |
| $1.5 to $2.0M |
29 |
33 |
24 |
41 |
36 |
34 |
50 |
126 |
| Over $2.0M |
46 |
50 |
43 |
41 |
51 |
52 |
60 |
453 |
| Totals |
266 |
250 |
256 |
263 |
235 |
242 |
273 |
806 |
The only two signs of trouble:
- The Under-$1M market is disappearing.
- If you want to buy a house priced over $2,000,000, you sure have plenty to consider! Those sellers are happy to wait it out too, so no rush.
Other than those, we have remarkable balance, and it doesn’t look like ‘potential buyers are putting their homeownership plans on hold’ around here!
by Jim the Realtor | Nov 27, 2018 | Actives/Pendings, Jim's Take on the Market, North County Coastal, NSDCC Pendings, Tax Reform |

Today the FHFA announced that they have raised the Fannie/Freddie mortgage limit to $726,525 in high-cost areas:
Link to Article
With deductible mortgage interest now capped at $750,000 by the I.R.S., buyers who are concerned about write-offs will want to keep their new loan balance in the $700,000s.
The strict equation is $750,000/80% = $937,500.
If buyers find a house priced higher, they could come up with more cash to make up the difference, or they could get a jumbo loan at roughly the same interest rate and live with the non-deductible interest paid on the loan amount above $750,000.
It makes the ideal purchase price in the $1,000,000-$1,100,000 range.
If the tax reform is a big concern for buyers as some have suggested, the homes priced in the $1,100,000 – $1,500,000 might feel it. Buyers above that range weren’t expecting as much benefit anyway, and probably won’t be as impacted – but theoretically there are fewer buyers the higher we go.
Out of curiosity, let’s keep an eye on the NSDCC stats.
Today’s NSDCC Actives and Pendings:
$700,000-$1,100,000: 121/72 = 1.68
$1,100,000-$1,500,000: 157/75 = 2.09
$1,500,000-$2,500,000: 243/81 = 3.00
$2,500,000 and higher: 399/44 = 9.07
The market has been healthy up to $1,500,000 roughly, and like Rob Dawg said yesterday, potential buyers may not know the exact impact of the tax reform until they start on their 2018 tax returns in spring.
Let’s come back then and check for impact!