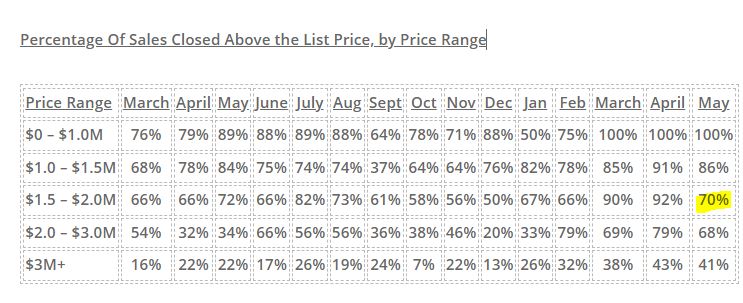
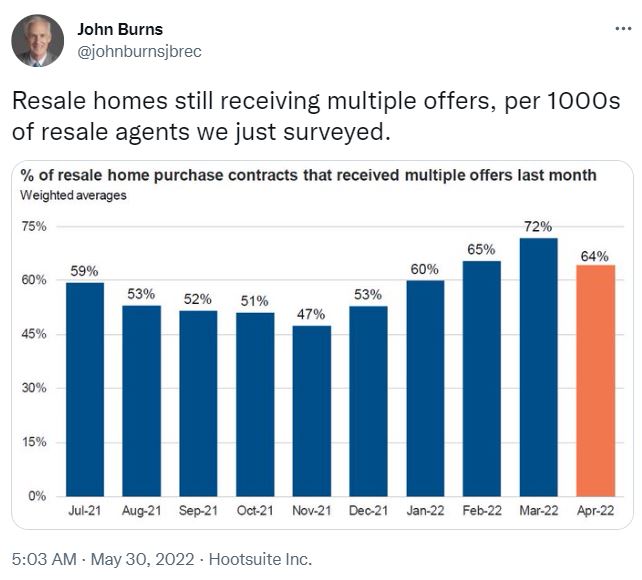
There was a slight decline in the percentage of sales closed over the list price in May, but it matched the peak month in 2021, and historically speaking, it still sounds wild that nearly two out of three buyers are paying more than the list price when we are at these crazy-high price points.
~~~~~~~~~~~~~~~~~~~~~~~~~~~~~~~~~~~~~~~~~~~~~~~
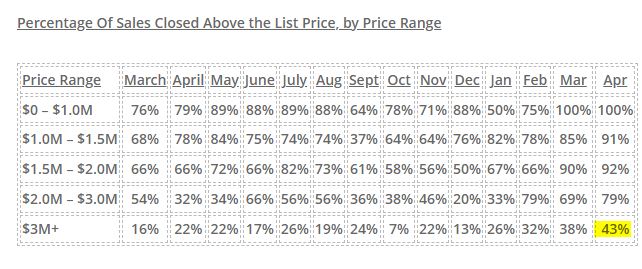
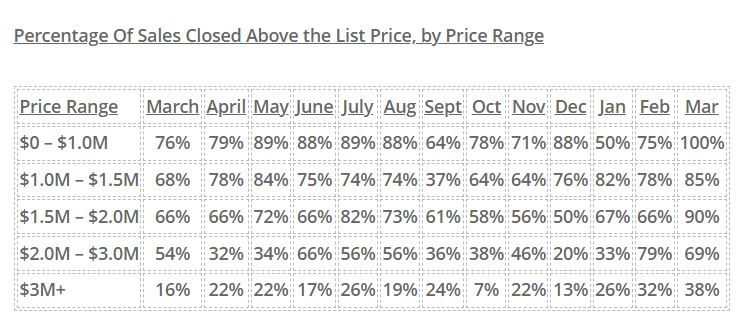
Here is how it breaks down by price range – the big decline was in one category:
NSDCC Average and Median Prices
Month
# of Sales
Avg. LP
Avg. SP
Median LP
Median SP
Feb
224
$2,298,797
$2,257,334
$1,719,500
$1,758,000
March
252
$2,295,629
$2,260,524
$1,800,000
$1,825,000
April
357
$2,396,667
$2,403,962
$1,799,900
$1,828,000
May
300
$2,596,992
$2,581,715
$1,900,000
$1,994,500
June
348
$2,509,175
$2,537,953
$1,900,000
$1,967,500
July
311
$2,421,326
$2,442,738
$1,795,000
$1,855,000
Aug
268
$2,415,075
$2,438,934
$1,897,000
$1,950,000
Sept
278
$2,479,440
$2,445,817
$1,899,000
$1,987,500
Oct
248
$2,754,470
$2,705,071
$1,899,000
$1,899,500
Nov
199
$2,713,693
$2,707,359
$1,999,000
$2,100,000
Dec
189
$2,686,126
$2,664,391
$1,985,000
$2,157,500
Jan
140
$2,828,988
$2,855,213
$2,234,944
$2,240,000
Feb
156
$3,058,406
$3,104,854
$2,149,500
$2,386,500
Mar
206
$3,254,033
$3,342,384
$2,425,000
$2,625,000
Apr
224
$3,205,239
$3,267,447
$2,372,500
$2,575,000
May
214
$2,941,080
$3,030,794
$2,350,000
$2,480,000
The average and median sales prices are dropping, but so are the list prices so it’s expected. The median sales price could dip another 13% and still be in positive territory for 2022!
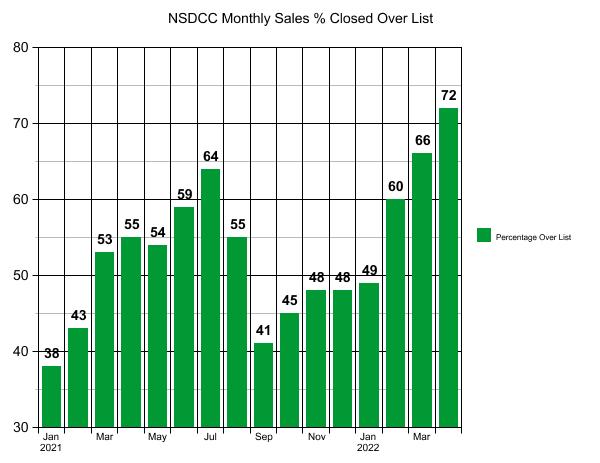
Will April be the peak month of buyers paying over the list price?
NSDCC Detached-Home Sales, % Closed Over List Price
Hard to imagine that there will ever be another month where nearly three-quarters of the home buyers end up paying over the list price!
~~~~~~~~~~~~~~~~~~~~~~~~~~~~~~~~~~~~~~~~~~~~~~~
How about those $3,000,000+ home buyers!
~~~~~~~~~~~~~~~~~~~~~~~~~~~~~~~~~~~~~~~~~~~~~~~
NSDCC Average and Median Prices
Month
# of Sales
Avg. LP
Avg. SP
Median LP
Median SP
Feb
224
$2,298,797
$2,257,334
$1,719,500
$1,758,000
March
252
$2,295,629
$2,260,524
$1,800,000
$1,825,000
April
357
$2,396,667
$2,403,962
$1,799,900
$1,828,000
May
300
$2,596,992
$2,581,715
$1,900,000
$1,994,500
June
348
$2,509,175
$2,537,953
$1,900,000
$1,967,500
July
311
$2,421,326
$2,442,738
$1,795,000
$1,855,000
Aug
268
$2,415,075
$2,438,934
$1,897,000
$1,950,000
Sept
278
$2,479,440
$2,445,817
$1,899,000
$1,987,500
Oct
248
$2,754,470
$2,705,071
$1,899,000
$1,899,500
Nov
199
$2,713,693
$2,707,359
$1,999,000
$2,100,000
Dec
189
$2,686,126
$2,664,391
$1,985,000
$2,157,500
Jan
140
$2,828,988
$2,855,213
$2,234,944
$2,240,000
Feb
156
$3,058,406
$3,104,854
$2,149,500
$2,386,500
Mar
206
$3,254,033
$3,342,384
$2,425,000
$2,625,000
Apr
224
$3,205,239
$3,267,447
$2,372,500
$2,575,000
Whoops – after the average sales price went up 7% MoM in January, 9% in February, and 8% in March, it dropped by 2% in April.
Same here – after the median sales price went up 4% MoM in January, 7% in February, and 10% in March, it dropped 2% in April too!
The median sales price could drop another 15% this year and still be in positive territory for 2022. Yet it would feel like a complete meltdown of epic proportions!
My tours of mid-range coastal suburban homes that sold for a big pop over list are slowing. But it’s mostly due to the lack of inventory – I wish I could do more!
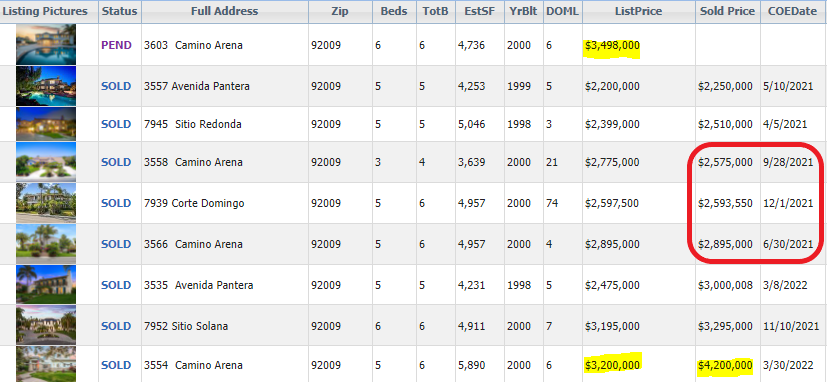
Well, the way it’s been going, it was bound to happen!
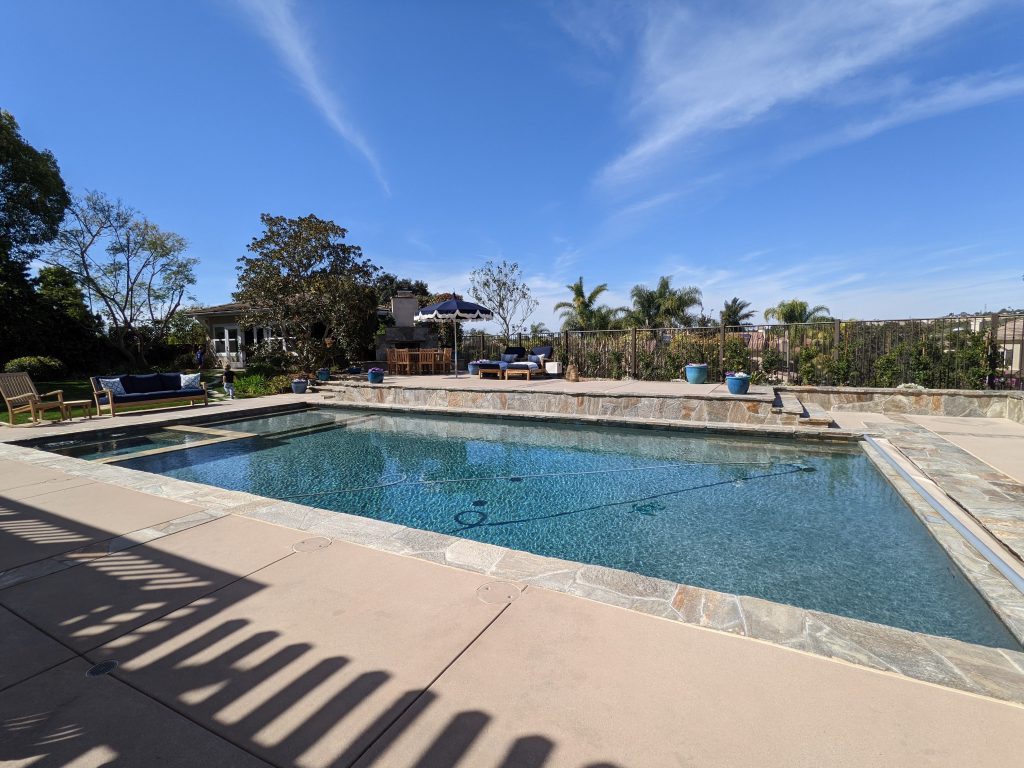
At least this house was fully remodeled, had a guest house (with double-tap kegerator!) and large pool all laid out nicely on a half-acre lot in the Ranch. This is the one I featured previously with the dozens of attendees at the open houses.
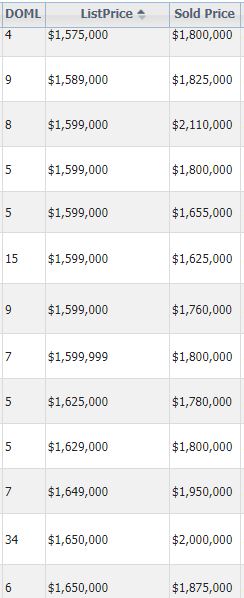
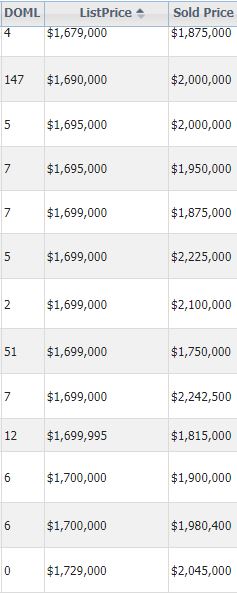
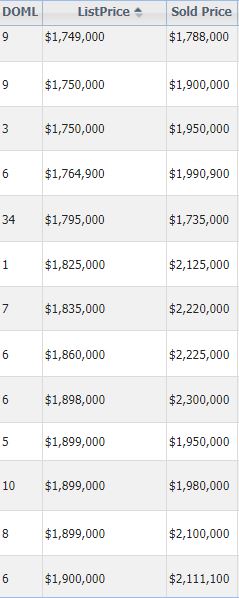
Here are the comps for the neighborhood – what was a trend in the upper-$2,000,000s in the second half of 2021 sure popped up in a hurry to $4 million+. The pending sale had “several offers and is way over list”, according to the listing agent:
Donna asked what sellers might think about his video.
I hope they think that old Jim the Realtor is tracking the market closer than anyone and would be the ideal listing agent because of how he is able to utilize this research to take advantage of the market at hand:
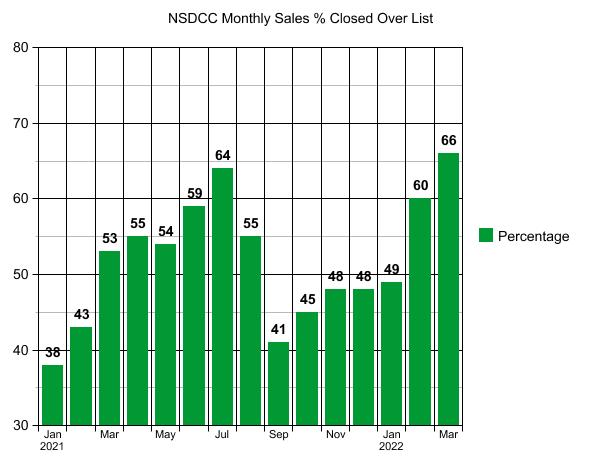
The market is heating up fast and early this year! The majority of home buyers paid over the list price in February, and these were decisions mostly made in January:
NSDCC Detached-Home Sales, % Closed Over List Price
January: 38%
February: 43%
March: 53%
April: 55%
May: 54%
June: 59%
July: 64%
August: 55%
September: 41%
October: 45%
November: 48%
December: 48%
January: 49%
February: 60%
~~~~~~~~~~~~~~~~~~~~~~~~~~~~~~~~~~~~~~~~~~~~~~~
~~~~~~~~~~~~~~~~~~~~~~~~~~~~~~~~~~~~~~~~~~~~~~~
Even though the 2022 listings count for the first two months of the year is 33% BELOW the count in 2021, sales are only 16% under the average for the last five years:
NSDCC January + February Sales
2017: 174 + 172 = 346
2018: 149 + 162 = 311
2019: 150 + 174 = 324
2020: 182 + 184 = 366
2021: 187 + 224 = 411
2022: 140 + 156 = 296
~~~~~~~~~~~~~~~~~~~~~~~~~~~~~~~~~~~~~~~~~~~~~~~
NSDCC Average and Median Prices
Month
# of Sales
Avg. LP
Avg. SP
Median LP
Median SP
Feb
224
$2,298,797
$2,257,334
$1,719,500
$1,758,000
March
252
$2,295,629
$2,260,524
$1,800,000
$1,825,000
April
357
$2,396,667
$2,403,962
$1,799,900
$1,828,000
May
300
$2,596,992
$2,581,715
$1,900,000
$1,994,500
June
348
$2,509,175
$2,537,953
$1,900,000
$1,967,500
July
311
$2,421,326
$2,442,738
$1,795,000
$1,855,000
Aug
268
$2,415,075
$2,438,934
$1,897,000
$1,950,000
Sept
278
$2,479,440
$2,445,817
$1,899,000
$1,987,500
Oct
248
$2,754,470
$2,705,071
$1,899,000
$1,899,500
Nov
199
$2,713,693
$2,707,359
$1,999,000
$2,100,000
Dec
189
$2,686,126
$2,664,391
$1,985,000
$2,157,500
Jan
140
$2,828,988
$2,855,213
$2,234,944
$2,240,000
Feb
156
$3,058,406
$3,104,854
$2,149,500
$2,386,500
The average sales price went up 7% MoM in January, and 9% in February.
The median sales price went up 4% MoM in January, and 7% in February.
THE MEDIAN SALES PRICE WENT UP 7% IN ONE MONTH!
This is the craziest real estate market ever – and the spring selling season is just getting started!
Even with the list prices reflecting massively-inflated values, nearly half of the homebuyers felt the need to pay over the list price lately:
NSDCC Detached-Home Sales, % Closed Over List Price
January: 38%
February: 43%
March: 53%
April: 55%
May: 54%
June: 59%
July: 64%
August: 55%
September: 41%
October: 45%
November: 48%
December: 48%
January: 49%
There were another 15% who paid full price in January, so almost two-thirds paid all the money. There were 16 listings that sold with zero days on market too.
~~~~~~~~~~~~~~~~~~~~~~~~~~~~~~~~~~~~~~~~~~~~~~~
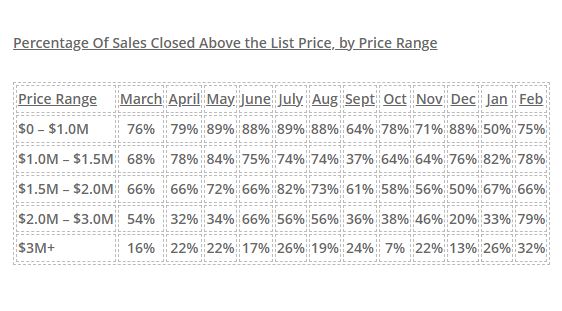
Percentage Of Sales Over List Price by Price Range
Price Range
March
April
May
June
July
Aug
Sept
Oct
Nov
Dec
Jan
$0 – $1.0M
76%
79%
89%
88%
89%
88%
64%
78%
71%
88%
50%
$1.0M – $1.5M
68%
78%
84%
75%
74%
74%
37%
64%
64%
76%
82%
$1.5M – $2.0M
66%
66%
72%
66%
82%
73%
61%
58%
56%
50%
67%
$2.0M – $3.0M
54%
32%
34%
66%
56%
56%
36%
38%
46%
20%
33%
$3M+
16%
22%
22%
17%
26%
19%
24%
7%
22%
13%
26%
~~~~~~~~~~~~~~~~~~~~~~~~~~~~~~~~~~~~~~~~~~~~~~~
The January sales were a little soft, historically, but the inventory has been decimated:
NSDCC January Sales
2017: 174
2018: 149
2019: 150
2020: 182
2021: 187
2022: 140
~~~~~~~~~~~~~~~~~~~~~~~~~~~~~~~~~~~~~~~~~~~~~~~
NSDCC Average and Median Prices
Month
# of Sales
Avg. LP
Avg. SP
Median LP
Median SP
Feb
224
$2,298,797
$2,257,334
$1,719,500
$1,758,000
March
252
$2,295,629
$2,260,524
$1,800,000
$1,825,000
April
357
$2,396,667
$2,403,962
$1,799,900
$1,828,000
May
300
$2,596,992
$2,581,715
$1,900,000
$1,994,500
June
348
$2,509,175
$2,537,953
$1,900,000
$1,967,500
July
311
$2,421,326
$2,442,738
$1,795,000
$1,855,000
Aug
268
$2,415,075
$2,438,934
$1,897,000
$1,950,000
Sept
278
$2,479,440
$2,445,817
$1,899,000
$1,987,500
Oct
248
$2,754,470
$2,705,071
$1,899,000
$1,899,500
Nov
199
$2,713,693
$2,707,359
$1,999,000
$2,100,000
Dec
189
$2,686,126
$2,664,391
$1,985,000
$2,157,500
Jan
140
$2,828,988
$2,855,213
$2,234,944
$2,240,000
The average sales price went up 7% MoM.
The median sales price went up 4% MoM.
The local pricing flattened out last summer, only to be revived over the last three months.
It should be a crazy spring – probably the craziest ever!
Momentum going into 2022 is strong, given that the Over List percentage has gone up the last two months:
NSDCC Detached-Home Sales, % Closed Over List Price
January: 38%
February: 43%
March: 53%
April: 55%
May: 54%
June: 59%
July: 64%
August: 55%
September: 41%
October: 45%
November: 48%
The higher-end market had some bounce-back too:
Percentage Of Sales Over List Price by Price Range
Price Range
March
April
May
June
July
Aug
Sept
Oct
Nov
$0 – $1.0M
76%
79%
89%
88%
89%
88%
64%
78%
71%
$1.0M – $1.5M
68%
78%
84%
75%
74%
74%
37%
64%
64%
$1.5M – $2.0M
66%
66%
72%
66%
82%
73%
61%
58%
56%
$2.0M – $3.0M
54%
32%
34%
66%
56%
56%
36%
38%
46%
$3M+
16%
22%
22%
17%
26%
19%
24%
7%
22%
The November sales were down 35% from last year, but the red-hot market of late-2020 is to blame. This year, the sales were more in line with previous Novembers:
NSDCC November Sales
2017: 217
2018: 199
2019: 212
2020: 306
2021: 199
NSDCC Average and Median Prices
Month
# of Sales
Avg. LP
Avg. SP
Median LP
Median SP
Feb
224
$2,298,797
$2,257,334
$1,719,500
$1,758,000
March
252
$2,295,629
$2,260,524
$1,800,000
$1,825,000
April
357
$2,396,667
$2,403,962
$1,799,900
$1,828,000
May
300
$2,596,992
$2,581,715
$1,900,000
$1,994,500
June
348
$2,509,175
$2,537,953
$1,900,000
$1,967,500
July
311
$2,421,326
$2,442,738
$1,795,000
$1,855,000
Aug
268
$2,415,075
$2,438,934
$1,897,000
$1,950,000
Sept
278
$2,479,440
$2,445,817
$1,899,000
$1,987,500
Oct
248
$2,754,470
$2,705,071
$1,899,000
$1,899,500
Nov
199
$2,713,693
$2,707,359
$1,999,000
$2,100,000
The median sales price went up 11% in one month, and is $101,000 higher than the median list price!
The median sales price is 19% higher than it was in February, which was ten months ago.


 ~~~~~~~~~~~~~~~~~~~~~~~~~~~~~~~~~~~~~~~~~~~~~~~