by Jim the Realtor | Nov 12, 2021 | 2021, Frenzy, Over List
The insanity is finding a comfortable range…..until next spring:
NSDCC Detached-Home Sales, % Closed Over List Price
January: 38%
February: 43%
March: 53%
April: 55%
May: 54%
June: 59%
July: 64%
August: 55%
September: 41%
October: 45%
A slight uptick in the overall percentage, but the high-end buyers aren’t going for this nonsense any more:
Percentage Of Sales Over List Price by Price Range
| Price Range |
March |
April |
May |
June |
July |
Aug |
Sept |
Oct |
| $0 – $1.0M |
76% |
79% |
89% |
88% |
89% |
88% |
64% |
78% |
| $1.0M – $1.5M |
68% |
78% |
84% |
75% |
74% |
74% |
37% |
64% |
| $1.5M – $2.0M |
66% |
66% |
72% |
66% |
82% |
73% |
61% |
58% |
| $2.0M – $3.0M |
54% |
32% |
34% |
66% |
56% |
56% |
36% |
38% |
| $3M+ |
16% |
22% |
22% |
17% |
26% |
19% |
24% |
7% |
October saw new highs in average list and sales prices, which would indicate strong action in the higher-end homes. The medians have been fairly steady:
NSDCC Average and Median Prices
| Month |
# of Sales |
Avg. LP |
Avg. SP |
Median LP |
Median SP |
| Feb |
224 |
$2,298,797 |
$2,257,334 |
$1,719,500 |
$1,758,000 |
| March |
252 |
$2,295,629 |
$2,260,524 |
$1,800,000 |
$1,825,000 |
| April |
357 |
$2,396,667 |
$2,403,962 |
$1,799,900 |
$1,828,000 |
| May |
300 |
$2,596,992 |
$2,581,715 |
$1,900,000 |
$1,994,500 |
| June |
348 |
$2,509,175 |
$2,537,953 |
$1,900,000 |
$1,967,500 |
| July |
311 |
$2,421,326 |
$2,442,738 |
$1,795,000 |
$1,855,000 |
| Aug |
268 |
$2,415,075 |
$2,438,934 |
$1,897,000 |
$1,950,000 |
| Sept |
278 |
$2,479,440 |
$2,445,817 |
$1,899,000 |
$1,987,500 |
| Oct |
248 |
$2,754,470 |
$2,705,071 |
$1,899,000 |
$1,899,500 |
The average sales price increased 30% YoY, and the median sales price is up 13% YoY, but that is also compared to the 382 sales last October – which was, and will always be, the most sales in any October.
As sales taper off over the next 2-3 months, it might cause a little more volatility in these pricing metrics.
~~~~~~~~~~~~~~~~~~~~~~~~~~~~~~~~~~~~~~
by Jim the Realtor | Oct 8, 2021 | 2021, Frenzy, Over List
Here is where the cooling-frenzy shows up.
The number of buyers who are willing to pay over list price is dropping:
NSDCC Detached-Home Sales, % Closed Over List Price
January: 38%
February: 43%
March: 53%
April: 55%
May: 54%
June: 59%
July: 64%
August: 55%
September: 41%
To have 41% of the sales close over list price would be remarkable….if it weren’t for the last six months!
Percentage Who Paid Over List Price by Price Range
| Price Range |
March |
April |
May |
June |
July |
Aug |
Sept |
| $0 – $1.0M |
76% |
79% |
89% |
88% |
89% |
88% |
64% |
| $1.0M – $1.5M |
68% |
78% |
84% |
75% |
74% |
74% |
37% |
| $1.5M – $2.0M |
66% |
66% |
72% |
66% |
82% |
73% |
61% |
| $2.0M – $3.0M |
54% |
32% |
34% |
66% |
56% |
56% |
36% |
| $3M+ |
16% |
22% |
22% |
17% |
26% |
19% |
24% |
The average sales prices have been virtually identical for the last three months, and the median sales price is back up to where it was in May:
NSDCC Average and Median Prices
| Month |
# of Sales |
Avg. LP |
Avg. SP |
Median LP |
Median SP |
| Feb |
224 |
$2,298,797 |
$2,257,334 |
$1,719,500 |
$1,758,000 |
| March |
252 |
$2,295,629 |
$2,260,524 |
$1,800,000 |
$1,825,000 |
| April |
357 |
$2,396,667 |
$2,403,962 |
$1,799,900 |
$1,828,000 |
| May |
300 |
$2,596,992 |
$2,581,715 |
$1,900,000 |
$1,994,500 |
| June |
348 |
$2,509,175 |
$2,537,953 |
$1,900,000 |
$1,967,500 |
| July |
311 |
$2,421,326 |
$2,442,738 |
$1,795,000 |
$1,855,000 |
| Aug |
268 |
$2,415,075 |
$2,438,934 |
$1,897,000 |
$1,950,000 |
| Sept |
278 |
$2,479,440 |
$2,445,817 |
$1,899,000 |
$1,987,500 |
Compared to last September, the average sales price was +25%, and the median sales price was +33%!
Sales should taper off the rest of the year, but not sure if pricing will follow!
~~~~~~~~~~~~~~~~~~~~~~~~~~~~~~~~~~~~~~
by Jim the Realtor | Sep 16, 2021 | Over List
The percentage of buyers who were willing to pay over list cooled a bit in August:
NSDCC Detached-Home Sales, % Closed Over List Price
January: 38%
February: 43%
March: 53%
April: 55%
May: 54%
June: 59%
July: 64%
August: 55%
There were 28% of the total sales that closed for $100,000+ over list price! (July was 33%)
The mix was remarkably similar to previous months:
Percentage Who Paid Over List Price by Price Range
| Price Range |
March |
April |
May |
June |
July |
Aug |
| $0 – $1.0M |
76% |
79% |
89% |
88% |
89% |
88% |
| $1.0M – $1.5M |
68% |
78% |
84% |
75% |
74% |
74% |
| $1.5M – $2.0M |
66% |
66% |
72% |
66% |
82% |
73% |
| $2.0M – $3.0M |
54% |
32% |
34% |
66% |
56% |
56% |
| $3M+ |
16% |
22% |
22% |
17% |
26% |
19% |
The average prices were down just slightly, but the medians went up:
NSDCC Average and Median Prices
| Month |
# of Sales |
Avg. LP |
Avg. SP |
Median LP |
Median SP |
| Feb |
224 |
$2,298,797 |
$2,257,334 |
$1,719,500 |
$1,758,000 |
| March |
252 |
$2,295,629 |
$2,260,524 |
$1,800,000 |
$1,825,000 |
| April |
357 |
$2,396,667 |
$2,403,962 |
$1,799,900 |
$1,828,000 |
| May |
300 |
$2,596,992 |
$2,581,715 |
$1,900,000 |
$1,994,500 |
| June |
348 |
$2,509,175 |
$2,537,953 |
$1,900,000 |
$1,967,500 |
| July |
311 |
$2,421,326 |
$2,442,738 |
$1,795,000 |
$1,855,000 |
| Aug |
268 |
$2,415,075 |
$2,438,934 |
$1,897,000 |
$1,950,000 |
Compared to last August, the average sales price was +27%, and the median sales price was +37%!
In July, they were +31% and +30%.
Fewer sales, and higher prices. Sales should taper off the rest of the year, but not sure if pricing will follow!
~~~~~~~~~~~~~~~~~~~~~~~~~~~~~~~~~~~~~~
by Jim the Realtor | Aug 19, 2021 | 2021, Frenzy, Over List, Sales and Price Check, Zillow
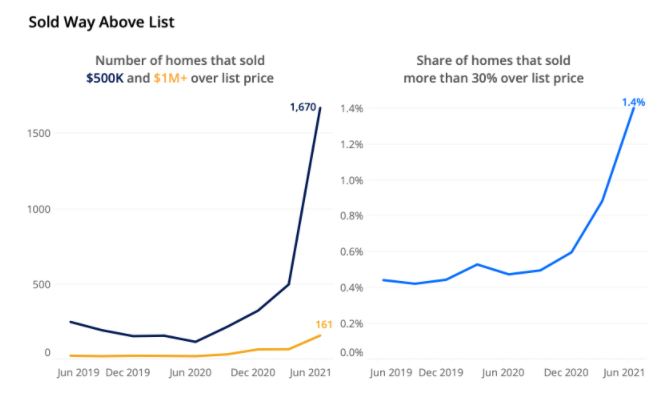
San Francisco leads the 50 largest U.S. metros in the share of homes sold for 30% over their list price or higher at 7.4%. It’s followed by the hot market of Buffalo, NY, where 6.2% of homes sold for more than 30% over list, and Austin (5.3%). All shares in these markets are up substantially over the first quarter.
The markets with the most homes sold for half a million or more over asking in the second quarter are San Francisco (657), San Jose (283), Los Angeles (99), Seattle (88) and Miami (74).
https://www.zillow.com/research/share-of-homes-sold-way-over-list-doubles-29974/
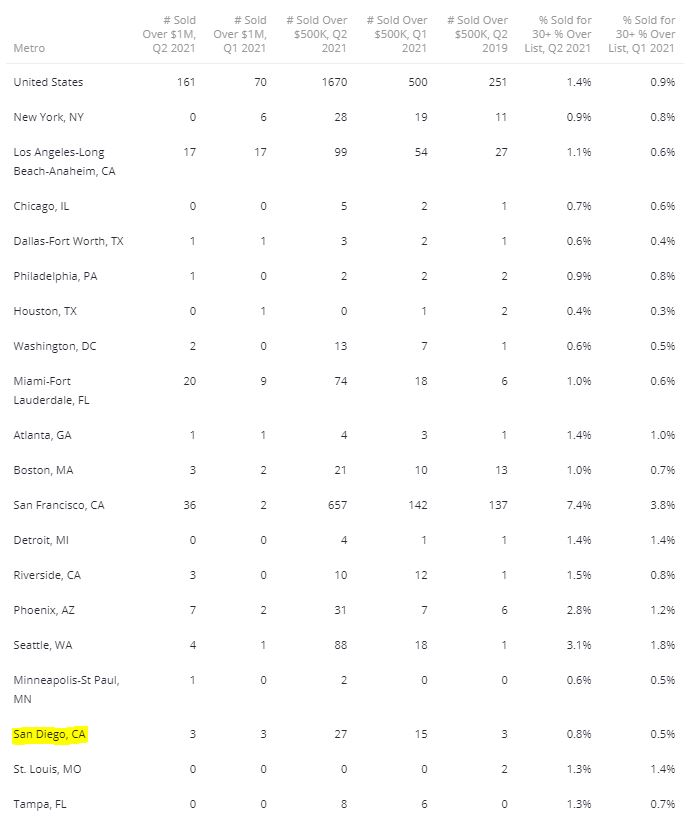
Can we find the six that sold for $1,000,000 over list? I went looking for that needle in a haystack, but couldn’t find any. If you know of the properties that for more than a million dollars over list this year, let us know! The 2021 numbers are staggering, given the pricing:
San Diego County First-Half Sales, All Property Types
| Year |
Total Sales |
Median SP |
Median DOM |
Sales Over $3,000,000 |
| 2017 |
19,236 |
$521,000 |
22 |
150 |
| 2018 |
17,922 |
$554,000 |
14 |
156 |
| 2019 |
16,981 |
$569,000 |
20 |
159 |
| 2020 |
15,037 |
$593,000 |
14 |
155 |
| 2021 |
20,263 |
$702,000 |
9 |
485 |
Record pricing, and record sales at the same time – what a frenzy!
by Jim the Realtor | Aug 13, 2021 | 2021, Bidding Wars, Frenzy, Over List
The percentage of buyers who were willing to pay over list reached another all-time high in July:
NSDCC Detached-Home Sales, % Closed Over List Price
January: 38%
February: 43%
March: 53%
April: 55%
May: 54%
June: 59%
July: 64%
There were 33% of the total sales that closed for $100,000+ over list price!
One out of three!
In July, it was the $1,500,000-$2,000,000 range that was red hot, with an incredible 82% paying over list:
Percentage Who Paid Over List Price by Price Range
| Price Range |
March |
April |
May |
June |
July |
| $0 – $1.0M |
76% |
79% |
89% |
88% |
89% |
| $1.0M – $1.5M |
68% |
78% |
84% |
75% |
74% |
| $1.5M – $2.0M |
66% |
66% |
72% |
66% |
82% |
| $2.0M – $3.0M |
54% |
32% |
34% |
66% |
56% |
| $3M+ |
16% |
22% |
22% |
17% |
26% |
The average and median prices were slightly lower MoM, but the product mix is different every month. Just having the average and median sales prices being higher than the list prices is remarkable enough:
NSDCC Average and Median Prices
| Month |
# of Sales |
Avg. LP |
Avg. SP |
Median LP |
Median SP |
| Feb |
224 |
$2,298,797 |
$2,257,334 |
$1,719,500 |
$1,758,000 |
| March |
252 |
$2,295,629 |
$2,260,524 |
$1,800,000 |
$1,825,000 |
| April |
357 |
$2,396,667 |
$2,403,962 |
$1,799,900 |
$1,828,000 |
| May |
300 |
$2,596,992 |
$2,581,715 |
$1,900,000 |
$1,994,500 |
| June |
348 |
$2,509,175 |
$2,537,953 |
$1,900,000 |
$1,967,500 |
| July |
311 |
$2,421,326 |
$2,442,738 |
$1,795,000 |
$1,855,000 |
| July, 2020 |
351 |
$1,937,896 |
$1,863,623 |
$1,450,000 |
$1,423,350 |
Compared to last July, the average sales price was +31%, and the median sales price was +30%!
~~~~~~~~~~~~~~~~~~~~~~~~~~~~~~~~~~~~~~
by Jim the Realtor | Jul 6, 2021 | 2021, Frenzy, Frenzy Monitor, Jim's Take on the Market, Over List
The percentage of buyers who were willing to pay over list reached another all-time high in June:
NSDCC Detached-Home Sales, % Closed Over List Price
January: 38%
February: 43%
March: 53%
April: 55%
May: 54%
June: 59%
There were 37% of the total sales that closed for $100,000+ over list price!
The action was really hot in the $2,000,000s – the other price ranges cooled off slightly:
Percentage Who Paid Over List Price by Price Range
| Price Range |
March |
April |
May |
June |
| $0 – $1.0M |
76% |
79% |
89% |
88% |
| $1.0M – $1.5M |
68% |
78% |
84% |
75% |
| $1.5M – $2.0M |
66% |
66% |
72% |
66% |
| $2.0M – $3.0M |
54% |
32% |
34% |
66% |
| $3M+ |
16% |
22% |
22% |
17% |
After rising in six-figure amounts the previous month, it looks like pricing might be leveling off too:
NSDCC Average and Median Prices
| Month |
# of Sales |
Avg. LP |
Avg. SP |
Median LP |
Median SP |
| Feb |
224 |
$2,298,797 |
$2,257,334 |
$1,719,500 |
$1,758,000 |
| March |
252 |
$2,295,629 |
$2,260,524 |
$1,800,000 |
$1,825,000 |
| April |
357 |
$2,396,667 |
$2,403,962 |
$1,799,900 |
$1,828,000 |
| May |
300 |
$2,596,992 |
$2,581,715 |
$1,900,000 |
$1,994,500 |
| June |
348 |
$2,509,175 |
$2,537,953 |
$1,900,000 |
$1,967,500 |
We’ve been experiencing the hottest real estate market in the history of the world!
~~~~~~~~~~~~~~~~~~~~~~~~~~~~~~~~~~~~~~
by Jim the Realtor | Jun 8, 2021 | 2021, Frenzy, Frenzy Monitor, Jim's Take on the Market, Over List |
Based on these closed sales, the local frenzy has been steady this year – though these are results of buying decisions made as far back as January and February.
For the most part, we have as many or more sales, and the same or higher LP:SP ratios over the last 60 days compared to the sales in the 60 days prior to April 23rd:
Detached-Home Sales By Zip Code
| Town/Area |
Zip Code |
Sales 60 days Prior to April 23 |
LP:SP Ratio |
Last 60 Days |
LP:SP Ratio |
| Carlsbad NW |
92008 |
40 |
103% |
32 |
104% |
| Carlsbad SE |
92009 |
95 |
105% |
118 |
106% |
| Carlsbad NE |
92010 |
15 |
105% |
22 |
106% |
| Carlsbad SW |
92011 |
29 |
103% |
29 |
106% |
| Encinitas |
92024 |
87 |
103% |
92 |
104% |
| Carmel Valley |
92130 |
72 |
101% |
88 |
101% |
This shows that the frenzy trends have been fairly consistent so far this year. Tomorrow we’ll take another look at the active and pending counts to see if there is any drop-off in the works.
by Jim the Realtor | Jun 2, 2021 | 2021, Frenzy, Over List |
The number of May sales dropped month-over-month, even when we tack on another 10-25 late-reporters to the current tally:
NSDCC April sales: 357
NSDCC May Sales: 294
The April, 2021 sales were 35% higher than in April, 2019, but this year’s May sales were about the same as in 2019 (297). Was it due to less inventory? Not really:
NSDCC April Listings: 378
NSDCC May Listings: 371
But about the same percentage of buyers paid over list price:
NSDCC Detached-Home Sales, % Closed Over List Price
January: 38%
February: 43%
March: 53%
April: 55%
May: 54%
Most sellers and agents are happy just to get 1% to 5% over list.
The big winners who got 20% or more over list:
Most % Over List Price
| List Price |
Sales Price |
Percentage Over List Price |
| $985,000 |
$1,251,000 |
27% |
| $1,495,000 |
$1,900,000 |
27% |
| $1,349,000 |
$1,657,500 |
23% |
| $1,375,000 |
$1,688,000 |
23% |
| $1,500,000 |
$1,850,000 |
23% |
Is anyone surprised that sales are slowing down?
Not when you consider how fast the pricing went up just between April and May. The average list price jumped $200,000, and median list price increased $100,000 in just one month:
NSDCC Pricing of Monthly Listings
Average List Price, April: $2,396,667
Average List Price, May: $2,596,992 (+8%)
Median List Price, April: $1,799,900
Median List Price, May: $1,900,000 (+6%)
~~~~~~~~~~~~~~~~~~~~~~~~~~~~~~~~~~~~~~~~~
But how we measure the sales prices went up more. The average sales price went up $177,753, and the median sales price went up $166,500 – which is a 9% INCREASE IN ONE MONTH!
NSDCC Pricing of Monthly Sales
Average Sales Price, April: $2,403,962
Average Sales Price, May: $2,581,715 (+7%)
Median Sales Price, April: $1,828,000
Median Sales Price, May: $1,994,500 (+9%)
~~~~~~~~~~~~~~~~~~~~~~~~~~~~~~~~~~~~~~~
Percentage Who Paid Over List By Price Range:
Under $1.0M: 89% of all sales
$1.0M – $1.5M: 84%
$1.5M – $2.0M: 72%
$2.0M – $3.0M: 34%
Over $3.0M: 22%
~~~~~~~~~~~~~~~~~~~~~~~~~~~~~~~~~~~~~~~
It is natural to have sales decline with rapid price increases. The buyers at the margins can get priced out in a week or two, and then we have others who give up and aren’t going to play this game any more – or not until it becomes more rational.
We could be in for a Frenzy Soft Landing, where fewer sellers get lucky as we coast into the pricing plateau that should be coming later this year.
~~~~~~~~~~~~~~~~~~~~~~~~~~~~~~~~~~~~~~
by Jim the Realtor | May 4, 2021 | Over List |
The trend of paying over the list price continues!
NSDCC Detached-Home Sales, % Closed Over List Price
January: 38%
February: 43%
March: 53%
April: 55%
Most sellers and agents are happy just to get 1% to 5% over list.
The big winners who got 20% or more over list:
Most % Over List Price
| List Price |
Sales Price |
Percentage Over List Price |
| $1,900,000 |
$2,450,000 |
29% |
| $1,900,000 |
$2,400,000 |
26% |
| $1,999,900 |
$2,500,000 |
25% |
| $1,395,000 |
$1,740,000 |
25% |
| $969,000 |
$1,210,000 |
25% |
| $1,399,000 |
$1,700,000 |
22% |
| $1,099,000 |
$1,316,000 |
20% |
NSDCC Sales, April: 343
(the number of sales was 29% higher than in April, 2019)
Average List Price: $2,396,667
Average Sales Price: $2,403,962 (100%)
Median List Price: $1,799,900 ($100k higher than it was at the mid-April checkpoint)
Median Sales Price: $1,828,000 (102%)
~~~~~~~~~~~~~~~~~~~~~~~~~~~~~~~~~~~~~~~
Over List By Price Range:
Under $1.0M: 23 (79% of all sales)
$1.0M – $1.5M: 65 (78%)
$1.5M – $2.0M: 63 (665)
$2.0M – $3.0M: 23 (32%)
Over $3.0M: 15 (22%)
~~~~~~~~~~~~~~~~~~~~~~~~~~~~~~~~~~~~~~~
Some people have asked about the biggest winner because I sold the same model up the street for $1,900,000 in March. It had listed for $1,800,000. and there were three comps around $1.8 million then. My buyers offered the customary $100,000 over list and a 17-day escrow to win it, and they did.
It was the same model, with similar upgrades (mostly original), and similar peak ocean view, though the biggest winner had a larger culdesac lot which allowed for a pool and good-sized grass area, and the sellers had smartly added new wide-plank hardwood floors and did staging.
I know an agent who had buyers in the running at $2,200,000 but bowed out at that point. But he thought there were three other buyers going higher.
It sold for $2,450,000, which was 36% above the comps from the beginning of the year!
https://www.compass.com/listing/6343-di-vita-drive-carlsbad-ca-92009/744821423213993689/
I can’t apply any rational real estate practices to explain it.
by Jim the Realtor | Apr 20, 2021 | 2021, Bidding Wars, Frenzy, Over List
The trend of paying over the list price continues!
NSDCC Detached-Home Sales, % Closed Over List Price
January: 38%
February: 43%
March: 53%
1/2April: 57%
Most sellers and agents are happy just to get 1% to 5% over list. There were only 18 of 173 (10%) that sold for a double-digit percentage over list. The big winners:
Most % Over List Price
| List Price |
Sales Price |
Percentage Over List Price |
| $969,000 |
$1,210,000 |
25% |
| $1,399,000 |
$1,700,000 |
22% |
| $1,099,000 |
$1,316,000 |
20% |
| $1,425,000 |
$1,675,000 |
18% |
| $3,000,000 |
$3,500,000 |
17% |
| $1,499,000 |
$1,750,000 |
17% |
| $999,000 |
$1,160,000 |
16% |
NSDCC Sales, April (First Half): 173
(the number of sales was 45% higher than same period in 2019)
Average List Price: $2,349,402
Average Sales Price: $2,352,561 (100%)
Median List Price: $1,700,000
Median Sales Price: $1,750,000 (103%)
~~~~~~~~~~~~~~~~~~~~~~~~~~~~~~~~~~~~~~~
Over List By Price Range:
Under $1.0M: 12
$1.0M – $1.5M: 34
$1.5M – $2.0M: 36
$2.0M – $3.0M: 12
Over $3.0M: 5
~~~~~~~~~~~~~~~~~~~~~~~~~~~~~~~~~~~~~~~


