by Jim the Realtor | Jun 4, 2024 | 2024, Graphs of Market Indicators, Market Conditions, North County Coastal, Sales and Price Check
None of the pricing metrics are great but at least they demonstrate the trends over time. These graphs above are showing the latest data, including last month, and it’s all fairly positive….for now. With the extra inventory, buyers aren’t going to pay crazy money unless they see the perfect house. Sellers aren’t going to give them away though, so the trend for the rest of 2024 should be flat.
These graphs are interactive so scroll over to see the numbers.
There is extra unsold inventory but nobody is going to call this a flood, especially vs. 2019:
Sales will suffer as long as rates and prices are high. Have we gotten used to having fewer sales yet? The trend is going to last a while – probably for years to come:
Populations from the 2020 Census:
Carlsbad: 114,746
Encinitas: 62,007
Carmel Valley, 92130: 61,595
Rancho Santa Fe: 9,344
by Jim the Realtor | May 30, 2024 | Jim's Take on the Market, Market Conditions, Market Surge, Sales and Price Check |

Here’s a snapshot of how fast the local market has changed. It went from a relatively-modest suburban area where 3/4s of the houses sold for less than a million dollars in 2003……to a very affluent market!
NSDCC Detached-Homes Annual Sales
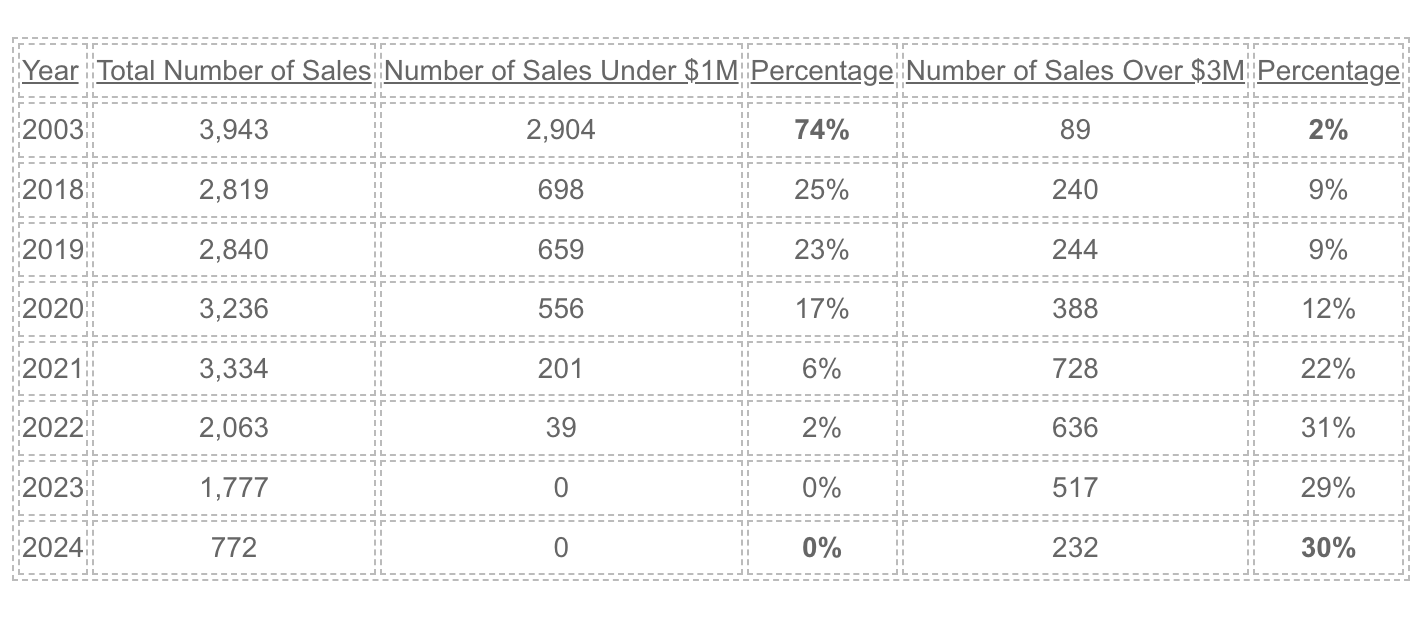
True, the inflation rate since 2003 was 70% and a dollar doesn’t buy what it used to back then. But the median sales price went up from $730,000 in 2003 to $2,344,000 this month – an increase of 320%!
by Jim the Realtor | May 6, 2024 | North County Coastal, Sales and Price Check
This sales count is tremendous – and there will still be some late-reporters:
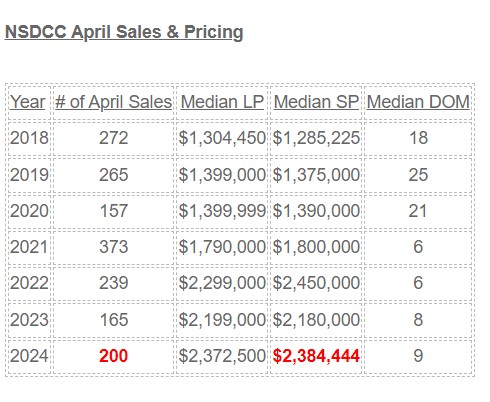
The median sales price is back to being higher than the median list price, and it is 10% higher than it was last April – wow!
by Jim the Realtor | May 2, 2024 | North County Coastal, Sales and Price Check
The interactive graphs updated with April stats for the three middle-of-the-road zip codes in San Diego County’s north coastal region. While there was some slumping after rates started rising in May, 2022, pricing has mostly recovered since:
Move your cursor over the graph to see the specific numbers.
by Jim the Realtor | Apr 25, 2024 | Sales and Price Check
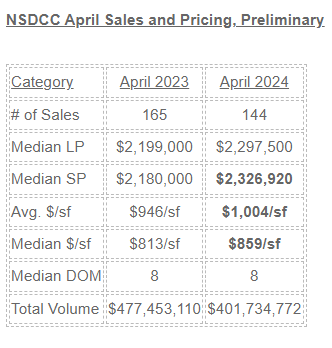
There may be a lot of turbulence around real estate these days, but sales keep happening!
The pricing metrics are up 5%-6% since last April, and we’re not done yet with sales this month. Helped by Easter being on March 31st this year, the final count of closings for April, 2024 is probably going to exceed last year’s 165 sales – wow!
by Jim the Realtor | Apr 15, 2024 | 2024, Jim's Take on the Market, North County Coastal, Sales and Price Check, Why You Should List With Jim |

The first quarter of 2024 is the only 1Q in recent history to have increases in BOTH the number of listings AND the median list price. Previously, increases in pricing had a corresponding dip in the number of listings available for buyers to consider.
If you are like me, you’ve seen a noticeable surge in seller optimism in 2024. It’s not just the median list price that is up 8%, doesn’t it seem like everything is $200,000 higher than last year?
by Jim the Realtor | Mar 1, 2024 | 2024, Jim's Take on the Market, Sales and Price Check
Happy March!
These are updated on the first of the month and are interactive:
No real concerns there. The low volume causes the bumpy appearance, but for the most part, the pricing is fairly steady. If there were a downward trend for a few months, it would be different.
by Jim the Realtor | Feb 28, 2024 | 2024, Frenzy, Sales and Price Check
This month’s housing stats will benefit from an extra business day due to the leap year, but it will just be icing on the cake. The sales this month have already blown by last February, in spite of higher pricing.
I think we can say that we’re back to frenzy-like conditions:

Some agents insist on inputting their listings of attached homes in the SFR category. There has only been ONE house sale under $1,000,000 in the last three Februarys.
This month’s total will probably be around 160-170 sales, which is phenomenal when you consider that we had similar monthly sales counts when pricing was half of what it is today! Not only that, but the number of sales will be close to the total number of listings too – probably closer than during the peak frenzy years.
With declining sales across the country, there are complaints about how bad the market has been, and people are wondering when it will get ‘better’. Better? This is great, relatively, and this is what we’re going to have for the next few years because the boomers are still relatively young (half are still working).
It will take a surge of new listings, and/or a drop in demand, which you’d think would happen naturally as prices go higher. But not yet.
How’s the flow of new listings?
After a hot January that was +18% YoY, the February listings have cooled off – though there will be late-reporters that should get this year’s count up to 220-ish:
NSDCC Monthly Listings
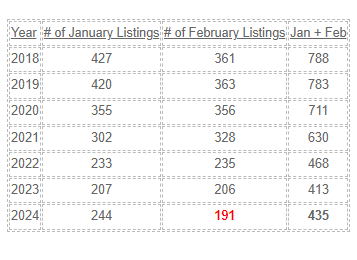
Two months into the new year, I think we have found our groove. The inventory will stay low, and the special homes will keep blowing off the market – with the rest having to find their way.
by Jim the Realtor | Feb 7, 2024 | Forecasts, Sales and Price Check, Zillow
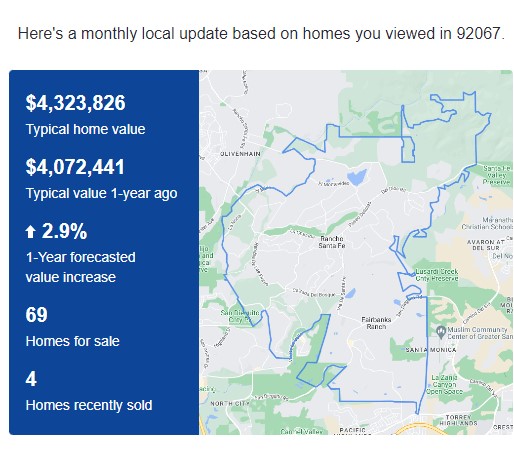
If Zillow made their predictions based on traffic to their website, it would be impressive. I’m not sure how they figure these though.
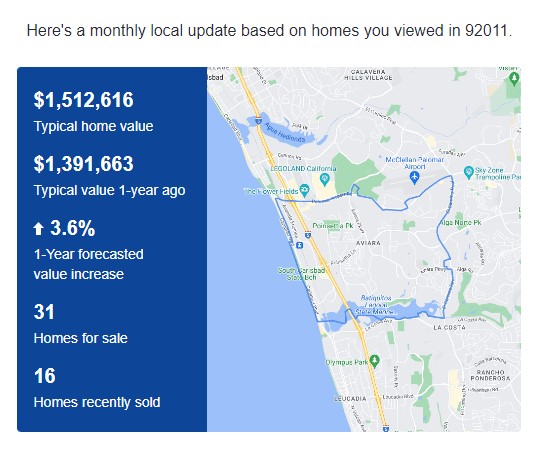
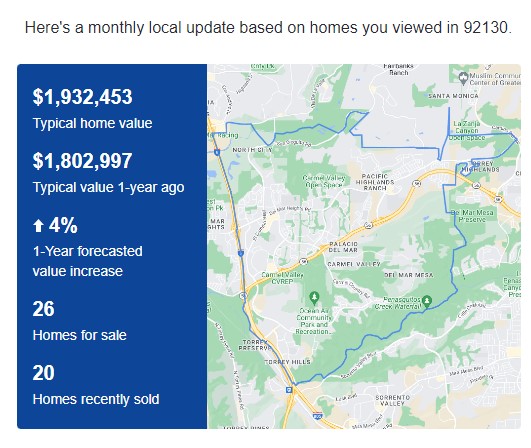
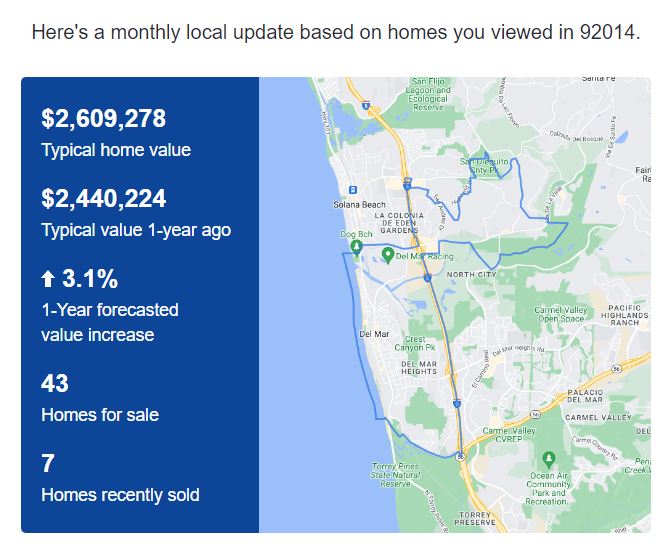
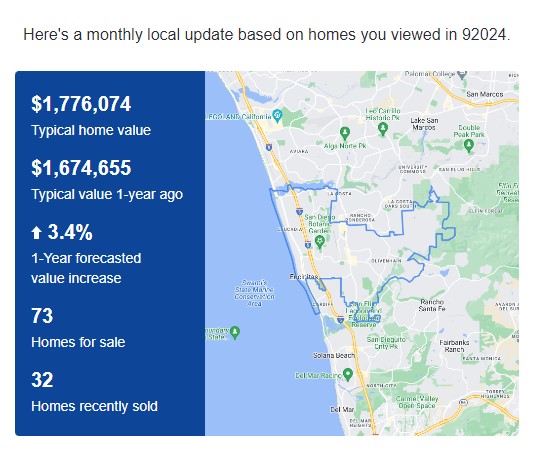
Generally, they are expecting +3% to 4% in home values around here over the next 12 months:
Carlsbad 92008
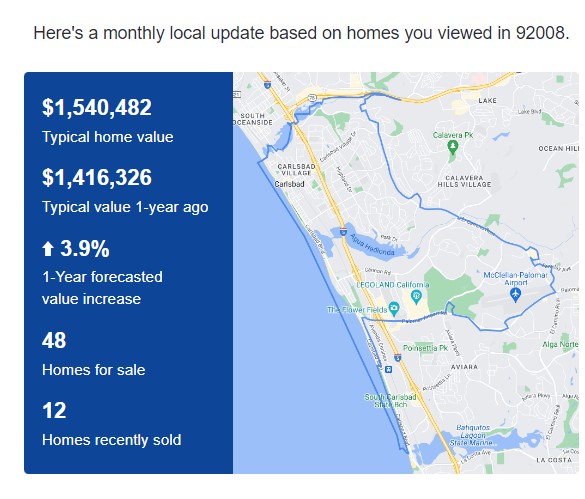
Carlsbad 92009
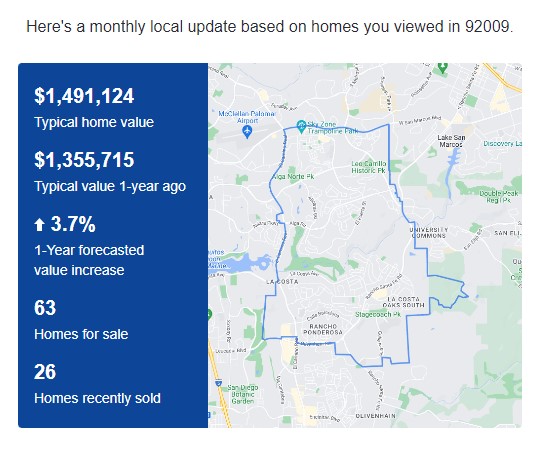
Carlsbad 92010
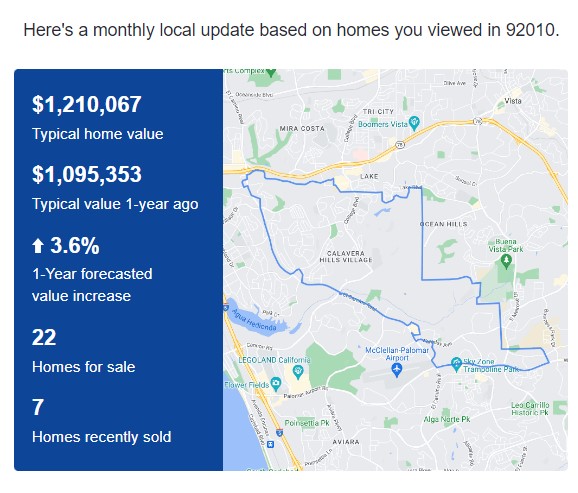
Carlsbad 92011
Carmel Valley 92130
Del Mar 92014
Encinitas 92024
Rancho Santa Fe 92067
by Jim the Realtor | Feb 6, 2024 | North County Coastal, Sales and Price Check
January Detached-Home Sales & Pricing, La Jolla to Carlsbad
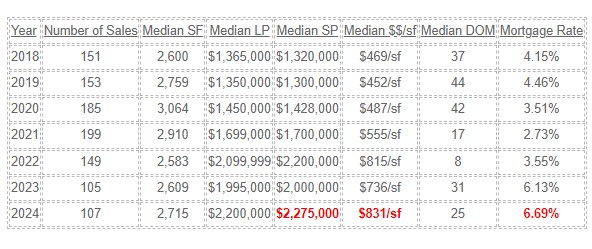
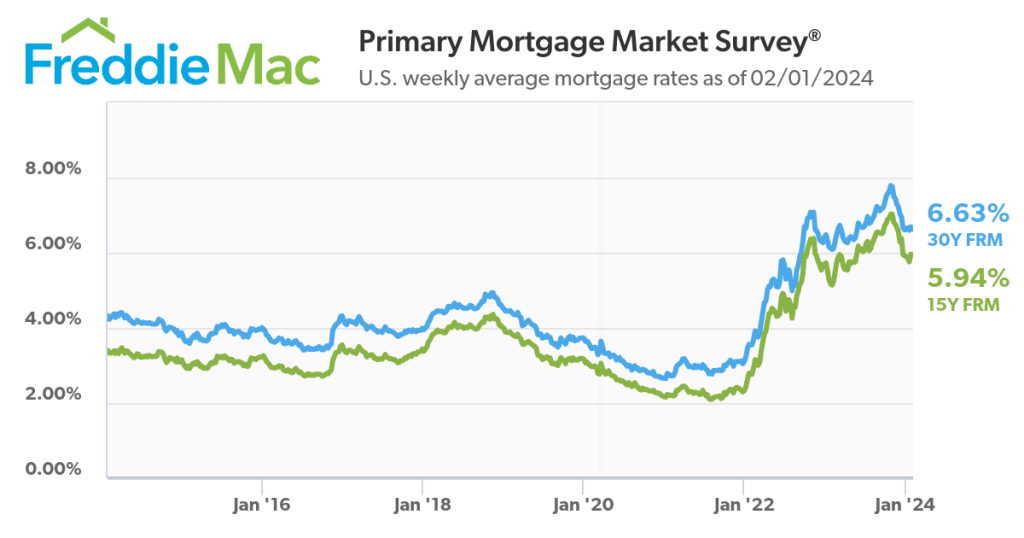
It was in June, 2022 that Fed Chair Jerome Powell told reporters that spiked mortgage rates would “reset” the “overheated” pandemic housing market.
Last month had the highest pricing metrics AND the highest January mortgage rate in recent history!
