by Jim the Realtor | Oct 17, 2023 | Sales and Price Check
Even as the doom continues to pour in from other areas that aren’t as fortunate as the North San Diego County coastal region, our home sales are defying expectations. Two facts:
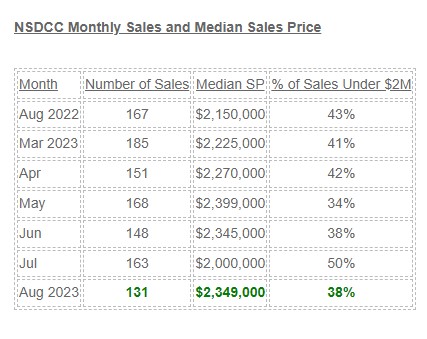
- In September, 2022, there were 146 sales with a median sales price of $1,940,000 (16% lower).
- There have already been 66 sales closed this month, and the current MSP is $2,150,000.
Although it would seem like a miracle, having 100+ sales per month in the fourth quarter of 2023 with a median sales price staying above $2,000,000 looks possible.
by Jim the Realtor | Oct 11, 2023 | Sales and Price Check
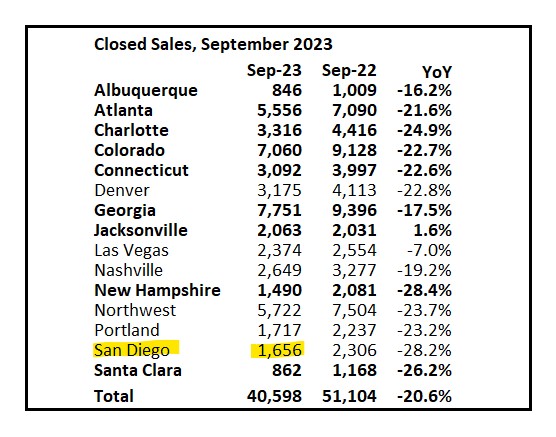
The local sales numbers are frightening. Compare our sales counts to these areas:
Populations / Sales = People Per Sale
New Hampshire: 1,389,000 / 1,490 = 932
Portland metro: 2,220,000 / 1,717 = 1,293
Las Vegas metro: 2,227,000 / 2,374 = 938
Charlotte metro: 2,267,000 / 3,316 = 684
Denver metro: 2,931,000 / 3,175 = 923
San Diego: 3,319,000 / 1,656 = 2,004
Here is how they compare – the high month in 2023 was similar to the annual low month perviously!
Sellers will have to do more than ever to improve their home for sale – just to get in the running!
by Jim the Realtor | Oct 10, 2023 | Sales and Price Check
The following metro areas had year-over-year median home price increases of 10% or more since September 2022:
- Los Angeles: 23.8%
- San Diego: 18.2%
- Richmond: 15%
- Cincinnati, Ohio: 14.6%
- Providence, Rhode Island and Massachusetts: 14.6%
- Boston: 14.1%
- Columbus, Ohio: 12.1%
- Rochester, New York: 11.4%
- Pittsburgh: 10.6%
- Chicago: 10.3%
- Indianapolis: 10%
In almost all of these cities, prices leveled off or decreased in late 2022, only to rise again in 2023, according to Realtor.com data. As is the case nationally, home prices have risen in these places because there are simply not enough homes built to meet demand, says Danielle Hale, chief economist at Realtor.com.
California has a longstanding housing shortage — perhaps the worst in the country — so home price growth in L.A. and San Diego isn’t overly surprising, especially considering price gains in recent years. Median home prices in L.A. and San Diego have increased by 38% and 48% since January 2020, respectively, based on Realtor.com’s active listings data.
Link to Article
by Jim the Realtor | Sep 27, 2023 | Jim's Take on the Market, North County Coastal, Sales and Price Check
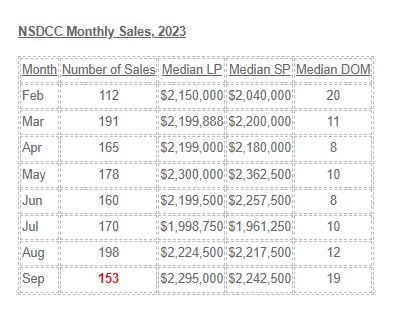
We’re having another amazing month, and should get close to 150 sales!
The pricing appears to be holding up nicely too (and more evidence that July’s collection of lower-priced sales was an anomaly).
by Jim the Realtor | Sep 14, 2023 | Sales and Price Check
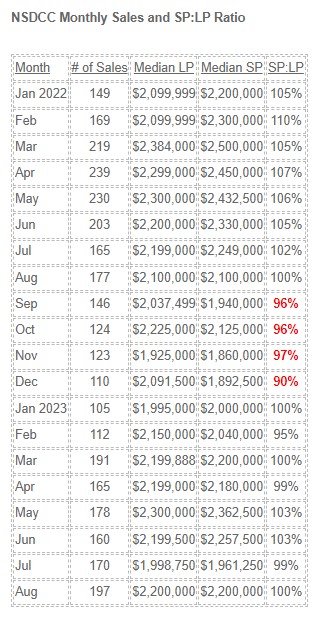
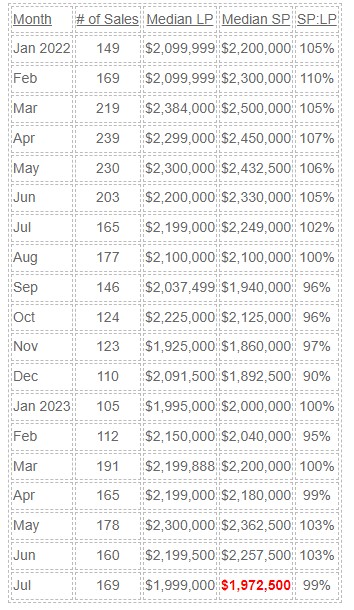
One of the best ways to monitor the pricing trends is to watch for changes in the SP:LP ratio. Last year the pricing got soft in the fourth quarter, so we’ll keep an eye on the SP:LP trend this year – but so far, so good:
by Jim the Realtor | Sep 12, 2023 | North County Coastal, Sales and Price Check
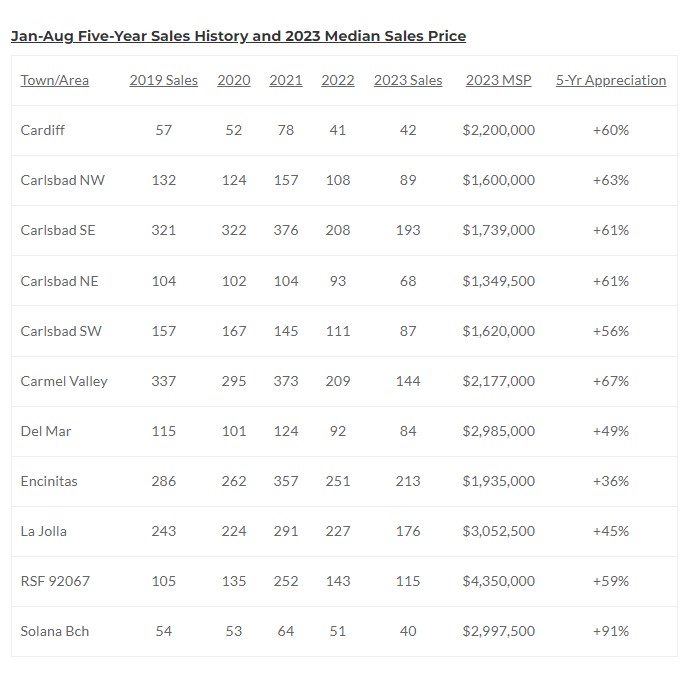
Here are each year’s sales counts for the January-through-August time frame.
It shows the extraordinary 2021 sales numbers in most areas!
But if you thought getting back to the numbers we had in 2019 would feel normal, we’re not there yet. In fact, most areas are well under their 2019 sales counts, except for Rancho Santa Fe!
The new normal is lower sales with sticky prices.
by Jim the Realtor | Sep 5, 2023 | Jim's Take on the Market, North County Coastal, Sales and Price Check |
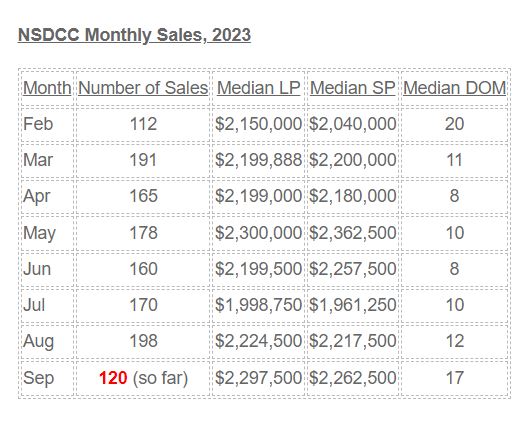
This is what it feels like in Plateau City. It’s a little bumpy but the pricing looks range-bound.
Sales cool off towards the end of the year – even during the frenzy. Surprisingly, last month might end up being the best of the year for sales, and the market should settle down for the rest of 2023….shouldn’t it?
There are only 157 NSDCC pendings today, so it’s likely that in the 4th quarter of 2023, the monthly sales will slip under 100 per month, which is fine. Everyone will be anticipating the spring selling season!
by Jim the Realtor | Aug 25, 2023 | Jim's Take on the Market, Sales and Price Check
My thoughts:
- Sales are holding up nicely here at the end of August – a time when the buyer pool could have, and should have been completely exhausted. With five business days to go plus late-reporters, we should see this month’s closed sales get up to 160 or so and be near the MoM and YoY numbers – with a higher median sales price.
- Of today’s 155 pending listings, 62 of them went into escrow prior to August. All of those 62 should have their contingencies released by now and are just waiting to close. If 40 of those close this month, and the final August sales count gets to 170+ it would be phenomenal. Compare to April, May, and June!
- Last month’s drop in the median sales price was a one-off.
There are no comparisons to pre-covid August counts. There were 262 sales in August, 2019, but that was way back when the NSDCC median sales price was $1,354,500 – ancient history!
Given where prices and rates are today, I’ll take 170 August sales though!
by Jim the Realtor | Aug 17, 2023 | North County Coastal, Sales and Price Check
The median sales price of houses sold between La Jolla and Carlsbad last month was 13% lower than it was in June, which demonstrates how terrible it is for a gauge.
Obviously, the houses sold are different each month. In July, there happened to be 35% more houses sold that were priced under $2,000,000 than in June (88 vs. 65), which dragged down the median sales price.
The recent sales counts are impressive, and we’ve already had 91 sales this month with two weeks to go!
We will muddle through!
by Jim the Realtor | Aug 3, 2023 | 2023, Jim's Take on the Market, Sales and Price Check |
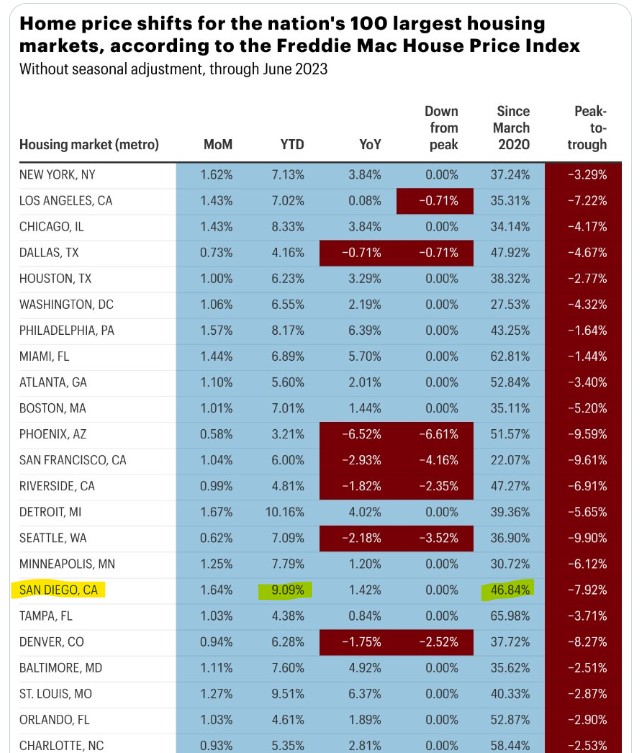
Of all the higher-end metros, San Diego is doing the best this year!
To see the rest of the Top 100 markets, click here:
https://twitter.com/NewsLambert/status/1686805363557888023


