by Jim the Realtor | Mar 14, 2023 | Jim's Take on the Market, North County Coastal, Sales and Price Check |
When it comes to anticipating the direction of the real estate market, the median pricing isn’t nearly as informative as these indicators – Number of Sales and SP:LP.
We are used to seeing the sales increase early in the year, but it could have been different if higher rates had broken the market. But it looks like we’re going to survive, especially when you see the SP:LP rising:
NSDCC Monthly Sales
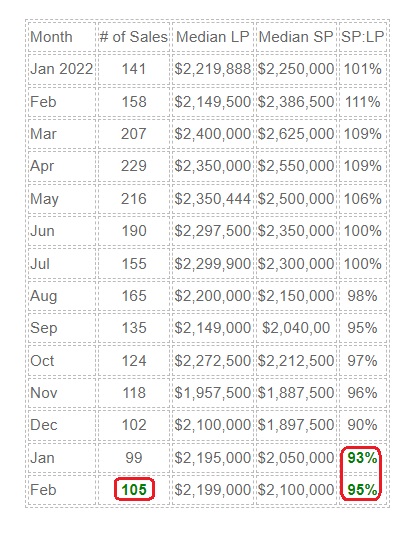
Last February, March, and April were scorching hot, and the market’s about-face in the second half of 2022 looks very orderly, in hindsight. Both the number of sales and SP:LP ratios were declining until recently, and now they make the rest of spring look promising.
by Jim the Realtor | Mar 3, 2023 | Jim's Take on the Market, North County Coastal, Sales and Price Check |
Combining the January and February stats gives us the larger sample sizes to better identify the trends.
The sellers are doing a phenomenal job at restricting the supply, and there have been enough buyers to keep the momentum going. The current listings/sales ratio is better than it was in the years before the frenzy, in spite of much higher pricing. Compare today’s pricing to 2021:

There were 78 of the 201 sales that were all-cash (39%).
It would help if there was more innovation in the mortgage world. You can get a 5-year fixed jumbo at 5.625% today, but with everyone buying their forever home, how many will want short-term money?
Without creative financing or lower rates, we will likely be on a long bumpy road for years to come.
by Jim the Realtor | Feb 24, 2023 | 2023, North County Coastal, Sales and Price Check |
We have an unusual obsession with home pricing – I say unusual because nobody cares that our measuring devices are deeply flawed and regularly give the wrong impression. With the stakes being so high, you’d think homebuyers would investigate thoroughly – but everyone just wants to grab and go!
You can see in the graph above how the smaller sample sizes cause more volatility – Encinitas only had 19 houses sold in December, and ten closings in January – so the 10% to 15% bounces up and down aren’t good representations of the pricing trend.
This is a better look at the trend – the average and median $$/sf for houses sold between La Jolla and Carlsbad, and this includes the 70 sales so far this month:

The upward trend should continue as more of the premium products come to market this spring.
I predicted that there wouldn’t be a sale under $2,000,000 in the Davidson Starboard tract in La Costa Oaks after we closed the Plan 2 in October. The first new listing there since is coming soon, priced at $2,899,000 and they should get all the money:
https://www.compass.com/app/listing/7657-sitio-algodon-carlsbad-ca-92009/1253018741329889369
I know they paid $1,999,919 in 2019, but there have been others that have closed for a million dollars over their 2019 purchase price. The Plan 3 layout probably isn’t as popular as the Plan 2, and the backyard is filled with a pool. But this street is a culdesac and it has the best south and west views which only come up occasionally for sale. It’s been so long since we’ve had an offering like this that I wouldn’t be surprised if she has 100+ people look at it next week – in spite of all the doom!
by Jim the Realtor | Feb 7, 2023 | 2023, Market Buzz, Sales and Price Check |
Realtors are known to comfort buyers who have lost a bidding war by saying, “There will be others”.
But will there be?
Especially for those at the entry level of every market….where the action is the hottest.
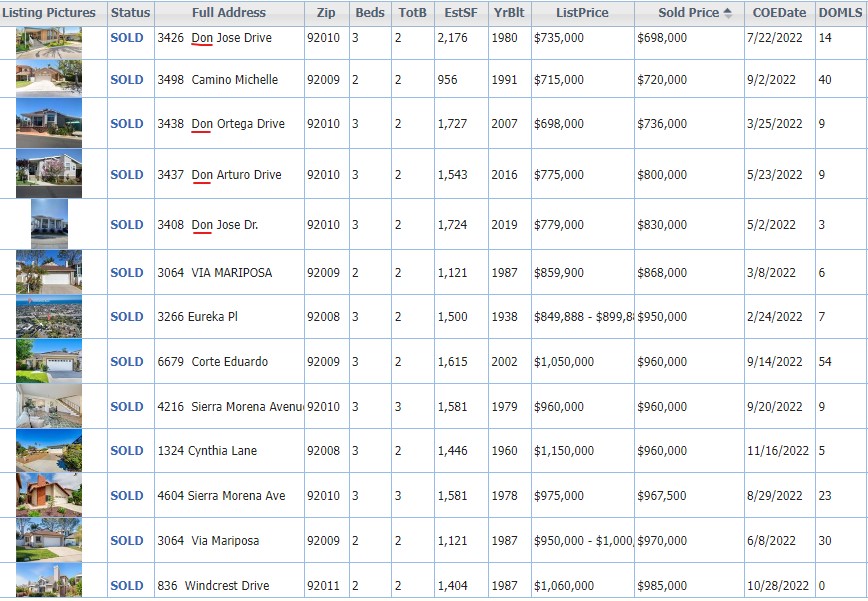
Above are the NINE houses that sold under a million dollars between La Jolla and Carlsbad in 2022. Those on the list with a street name that starts with Don are mobile homes in Rancho Carlsbad – which by itself might make you scratch your head when you see mobiles selling for as much as $830,000!
It’s early in the new year, and of course everyone thinks that home prices are coming down fast so this problem will be cured shortly (NOT!).
So far in 2023, this is the ONLY listing of a NSDCC detached-home priced under $1,000,000:
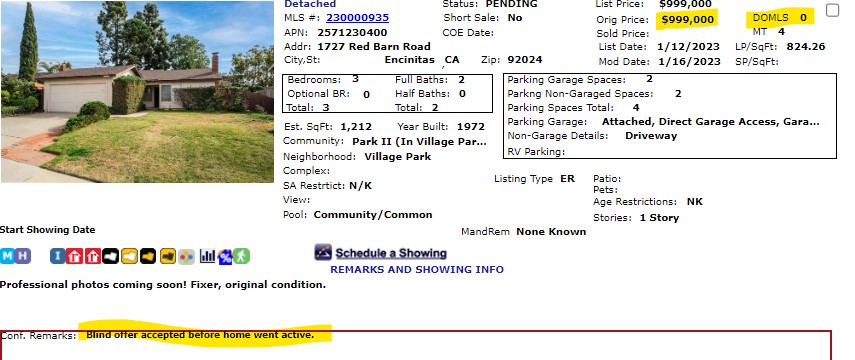
Oh, you want a decent home too? It’s even worse for the picky buyers.
Buyers can expect that pricing of decent entry-level homes this spring will start around these numbers:
Carlsbad: $1,250,000
Encinitas: $1,350,000
Carmel Valley: $1,800,000
RSF, Solana Beach, Del Mar, La Jolla: $2,000,000+
And good luck getting your hands on one!
by Jim the Realtor | Jan 27, 2023 | Jim's Take on the Market, North County Coastal, Sales and Price Check |
I was confident that in the last few months of 2022 we would reach at least 100 detached-home sales between Carlsbad and La Jolla. We are up to 102 in December, after closing 118 in November!
I wasn’t so hopeful about January.
As of today, there have been 68 closings this month.
We could have more sales, because there are 269 active listings sitting around. But only those that deserve it (those that do everything right) will be selling now.
Those that get it right are being rewarded…..they are selling! You could say that pricing is on an upward trend too, if you rely on the lame and inadequate median sales price to guide your decisions:
NSDCC Monthly Sales and Pricing
| Month |
# of Sales |
Average SP |
Avg. SF |
Median SP |
Med. SF |
| November |
118 |
$2,447,009 |
3,094sf |
$1,887,500 |
2,647sf |
| December |
102 |
$2,682,523 |
3,064sf |
$1,897,500 |
2,596sf |
| January |
68 (so far) |
$3,206,653 |
3,646sf |
$2,222,500 |
2,833sf |
| Dec-Jan MoM Diff |
-33% |
+20% |
+19% |
+17% |
+9% |
Unfortunately, the dated and backward-looking Case-Shiller Index comes out next Tuesday, and the doomers will use it to convince you that the market is coming apart.
But because sellers are holding out, only the homes that deserve to sell will be closing in 2023, and they should get pretty close to what they want, price-wise. Except those represented by desperate agents who fail miserably at doing everything right, and then take a lowball offer.
With the lower number of sales, don’t be surprised if the median sales price fluctuates wildly.
Here are Bill’s thoughts on sales and pricing:
https://calculatedrisk.substack.com/p/has-housing-bottomed
by Jim the Realtor | Dec 26, 2022 | Inventory, North County Coastal, Sales and Price Check |
The last Inventory Watch of 2022!
How does it compare to where we started?
Average List-Price-Per-SF of Detached-Homes Between La Jolla and Carlsbad
| Price Range |
First Week of January |
Last Week of December |
Difference |
| 0-$1,500,000 |
$832/sf |
$737/sf |
-11% |
| $1.5M – $2.0M |
$842/sf |
$810/sf |
-4% |
| $2.0M – $3.0M |
$1,080/sf |
$908/sf |
-16% |
| $3.0M – $4.0M |
$1,230/sf |
$1,222/sf |
-1% |
| $4.0M+ |
$1,884/sf |
$1,676/sf |
-11% |
A note on the $2.0M – $3.0M drop; the $/sf was down to $905/sf by February 28th when the frenzy was red hot so the $1,080/sf was an anomaly.
Today’s sellers have come down a little on price, but they’re not convinced yet. Even though there are more competitors today, there aren’t enough to feel like you have to give it away:
Number of Active Listings Between La Jolla and Carlsbad
| Price Range |
First Week of January |
Last Week of December |
| 0-$1,500,000 |
9 |
23 |
| $1.5M – $2.0M |
8 |
50 |
| $2.0M – $3.0M |
18 |
59 |
| $3.0M – $4.0M |
19 |
30 |
| $4.0M+ |
100 |
133 |
Hopefully next year’s sellers will agree that the lingering active listings are a sign of what’s not working.
(more…)
by Jim the Realtor | Dec 14, 2022 | 1-story, 2023, North County Coastal, Sales and Price Check, Why You Should List With Jim
Shadash said, “Right now the only thing propping up prices is limited supply.”
Indeed, and it’s how the pricing got here in the first place. The demand for homes in the San Diego coastal regions has been higher then the supply for decades now, and it’s probably not going to change that much – at least, not until more of the existing homeowners want to leave town or they go out feet first.
When selling, those who own the one-story homes will fare better.
It’s already happening – the market is splitting into one-story homes, and everything else:
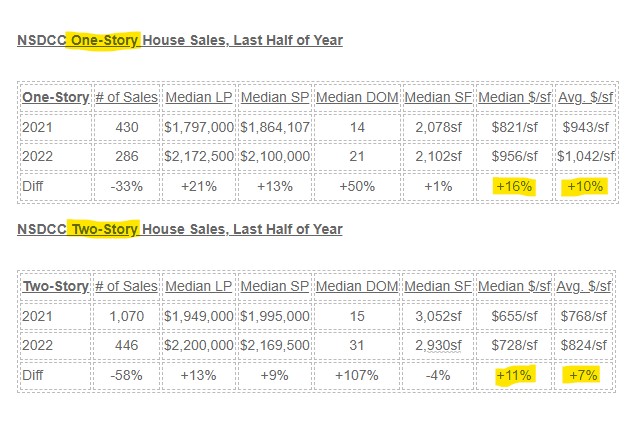
The buyers who need a big house are comforted in knowing they will pay less per-sf, but their appreciation rate will lag behind. The only thing that will inhibit an even-greater appreciation rate among the one-story homes is that we are transitioning into a market with more estate sales – which will primarily be fixers.
Either way, the current NSDCC pricing averages and medians are still very positive year-over-year. Nobody who sells next year should mind selling for more than they could have gotten in 2021.
It’s not that bad!
by Jim the Realtor | Dec 8, 2022 | North County Coastal, Sales and Price Check
There are concerns that lower pricing will cause recent home buyers to be underwater – and potentially create another bubble to pop. A factor to consider when assessing the current market conditions is how quickly the affluent buyers have taken over the marketplace between La Jolla and Carlsbad:
NSDCC Annual Detached-Home Sales
| Price Range |
2017 |
2018 |
2019 |
2020 |
2021 |
2022 |
| Under $1M |
1,040 |
706 |
667 |
543 |
120 |
20 |
| $1M-$2M |
1,475 |
1,505 |
1,552 |
1,784 |
1,621 |
684 |
| $2M-$3M |
384 |
383 |
405 |
518 |
766 |
588 |
| Over $3M |
232 |
236 |
244 |
385 |
724 |
607 |
| Totals |
3,131 |
2,830 |
2,868 |
3,230 |
3,231 |
1,899 |
We’re not done with 2022 but there will only be another 80-100 sales to add to this year’s total.
Two thoughts:
- The recent buyers had to qualify for financing (if any), and with virtually all of them paying over $1,000,000, they are probably flush and not many will get spooked into selling.
- When only the rich can participate, we won’t be having as many sales – with hardly any opportunities for the regular folks who hope to buy under $1,000,000.
Yes, if pricing keep coming down, there will be more sales in the lower-priced categories. But how many more under $1,000,000 next year? Forty? 80? It’s very unlikely that we will get back to the 2021 number, let alone have hundreds of homes selling under $1,000,000.
Not only will the inventory be lower, but the closed sales will probably decline next year too.
by Jim the Realtor | Dec 6, 2022 | Jim's Take on the Market, Sales and Price Check |
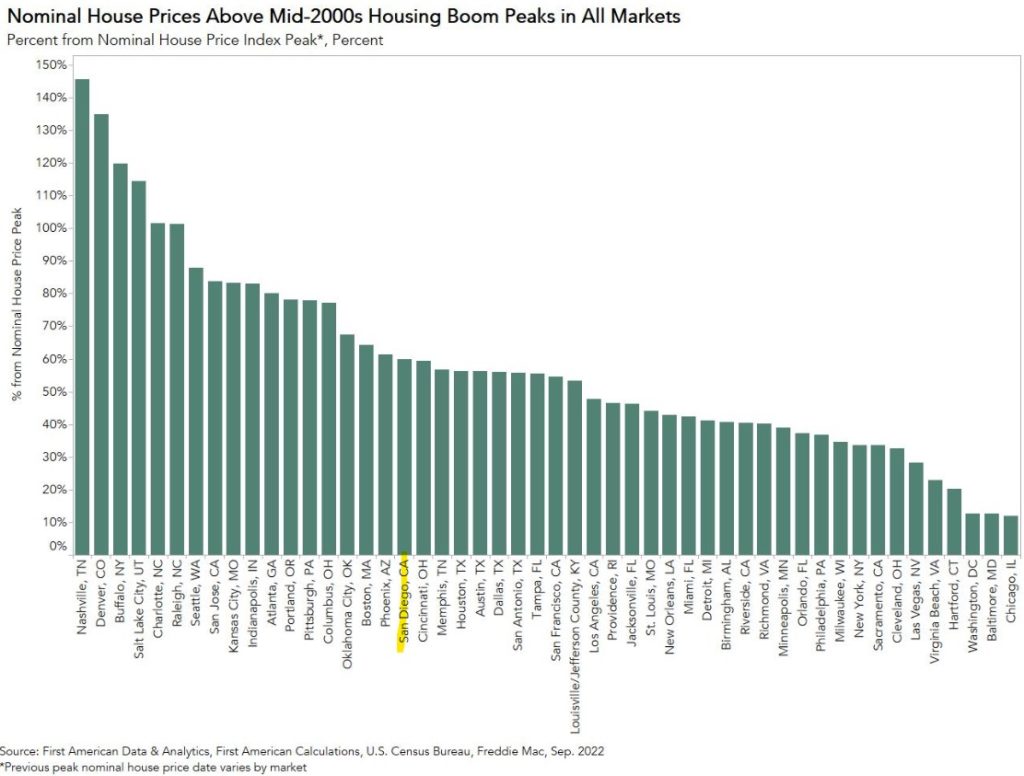
San Jose is ahead of us, and San Francisco is about the same. As long as the Bay Area remains an obvious feeder into the better-valued San Diego-Carlsbad market, we’ll be fine.
by Jim the Realtor | Dec 1, 2022 | Jim's Take on the Market, North County Coastal, Sales and Price Check, Why You Should List With Jim |

Yesterday a guy said he wasn’t interested in anecdotal evidence and just wanted to see the data. But we were talking about the buyer demand in 2023, of which we have no data yet.
In addition, the data we do have doesn’t have to repeat itself or be a trend, because every month we have different houses selling. It’s not like the stock indices that measure the exact same stock every day – in real estate, it’s a new set of variables every month. It’s a miracle that each month looks as similar as it does!
But for those who want the numbers, here you go!
NSDCC (La Jolla to Carlsbad) Monthly Sales Stats
| Date |
# of Sales |
Median Sales Price |
Median SF |
Avg DOM |
Avg. $/sf |
Med. $/sf |
| Jun |
190 |
$2,350,000 |
2,710sf |
23 |
$947/sf |
$837/sf |
| Jul |
155 |
$2,300,000 |
2,798sf |
28 |
$925/sf |
$830/sf |
| Aug |
165 |
$2,150,000 |
2,642sf |
36 |
$973/sf |
$804/sf |
| Sep |
135 |
$2,040,000 |
2,600sf |
38 |
$910/sf |
$793/sf |
| Oct |
124 |
$2,212,500 |
2,909sf |
43 |
$922/sf |
$784/sf |
| Nov |
109 |
$1,860,000 |
2,581sf |
42 |
$821/sf |
$739/sf |
For the record, here’s the summary from June to November:
Sales: –43%
Median Sales Price: –21%
Average Days-on-Market: +83%
Average $/sf: –13%
Median $/sf: –12%
The stats are straight off the SD MLS, and I’m not sure how they calculate their Median $/sf because it’s not the median sales price divided by the median sf – but their numbers are close to that.
There has been a steady downdraft in pricing, led by sellers who stay on the market for 30+ days and then take a lowball offer. As long as listings aren’t fully prepared, aren’t priced attractively, and are hard to show, the downward-pricing trend will continue.
Ideally, you want to sell your home in the first week or two that it is on the market.
Can sellers and agents adapt? Will they?


