by Jim the Realtor | Oct 31, 2022 | Jim's Take on the Market, Market Conditions, North County Coastal, Sales and Price Check |
I’ve been hoping for 100+ sales per month the rest of the way this year.
Currently, the October count is 108, so it should get up to around 120 sales by mid-November. Here are the monthly sales and pricing for 2022:
NSDCC Detached-Home Monthly Sales & Pricing, 2022
| Jan |
140 |
$2,828,988 |
$2,855,213 |
$2,234,944 |
$2,240,000 |
| Feb |
158 |
$3,063,331 |
$3,108,907 |
$2,149,500 |
$2,386,500 |
| Mar |
207 |
$3,247,251 |
$3,337,348 |
$2,400,000 |
$2,625,000 |
| Apr |
227 |
$3,190,161 |
$3,251,604 |
$2,350,000 |
$2,550,000 |
| May |
214 |
$2,941,080 |
$3,030,794 |
$2,350,000 |
$2,480,000 |
| Jun |
188 |
$2,871,956 |
$2,881,314 |
$2,297,500 |
$2,350,000 |
| Jul |
152 |
$2,892,729 |
$2,833,588 |
$2,272,000 |
$2,280,000 |
| Aug |
161 |
$2,953,967 |
$2,849,332 |
$2,200,000 |
$2,150,000 |
| Sep |
134 |
$2,652,892 |
$2,560,764 |
$2,134,500 |
$2,020,000 |
| Oct |
108 |
$3,168,167 |
$3,042,502 |
$2,250,000 |
$2,150,000 |
I noted last week that the September average and median sales prices were both 23% lower than they were in March. It looks like the final October data could end up being higher.
The average and median sales prices are easily affected by the types of homes that are selling. The recent environment has had smaller, less-expensive homes selling, while the higher-end market has been languishing.
Let’s include more statistics to fill out the picture:
| Month |
Sales |
Average SP |
Avg $$/sf |
Avg SF |
Median SP |
Med $$/sf |
Med SF |
| Mar |
207 |
$3,337,349 |
$1,028/sf |
3,498sf |
$2,625,000 |
$853/sf |
2,800sf |
| Sep |
134 |
$2,560,764 |
$911/sf |
2,887sf |
$2,020,000 |
$790/sf |
2,598sf |
| Oct |
108 |
$3,042,503 |
$931/sf |
3,387sf |
$2,150,000 |
$782/sf |
2,840sf |
While the October average and median sales prices make it look like we’ve turned the corner, once you analyze the house sizes and $$/sf, you’ll see that buyers are still getting more for their money today.
Unfortunately, none of the talking heads in the media will look any further than the median sales price.
Once their house-hunting vacation concludes in February, all potential home buyers will do is decide if the change in the median sales price supports their mindset about purchasing.
by Jim the Realtor | Oct 12, 2022 | Jim's Take on the Market, Local Flavor, North County Coastal, Padres, Sales and Price Check |
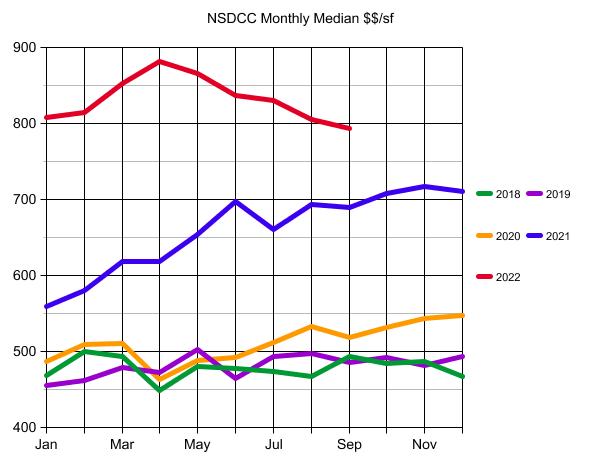
Instead of using the median sales price as a gauge, let’s look at the history of the median $/sf to help bring the size of the homes into the equation.
Thoughts:
I remember 2018 and 2019 being fairly flat and a bit of a struggle. Rates had been in the 3% to 4% range during the 2015-2017 period, and once they got back into the mid-to-high 4s in the summer of 2018, pricing hit the skids. Luckily, rates dropped under 4% in late-2019 which caused us to be optimistic about the selling season of 2020 – and you can see that pricing got off to a good start.
The Pandemic Stall caused a blip in April, 2020, but we recovered and charged into 2021. You could say that local pricing took off like a rocket, rising 25% in five months:
Jan 2021: $559/sf
Jun 2021: $697/sf
Today we are under where 2022 started, and it could get worse. However, the median for the 38 sales closed this month is an impressive $823/sf, which is 4% higher than last month.
But we have a long way to go!

Speaking of a long way to go, Rob Dawg wanted to stir it up, like most Dodger fans. We have been subject to endless taunting since making the playoffs, including Charlie Steiner suggesting that the Padres rivalry with the Dodgers would be like a nail having a rivalry with a hammer.
Just you wait!
Bob Melvin has engineered the greatest rope-a-dope since Muhammad Ali. Sacrificing the first game last night with Clevinger vs. Urias was ingenious, because Kershaw is washed up and due for a dud – and Darvish has been lights out.
The Padres win tonight, and then come home to the raucous crowd who hasn’t seen a playoff game in 16 years, and Petco Park will be rocking for Snellzilla. Then we got No-No-Joe for Saturday’s game and the Dodgers will have to bring back Urias early on three days rest and he won’t have enough.
This is the last chance to get on the Padres bandwagon!
by Jim the Realtor | Oct 5, 2022 | 2022, Frenzy, Realtor Post-Frenzy Playbook, Sales and Price Check, Why You Should List With Jim |
Last month, the 92009 median sales price declined 14.8% YoY, and was -22% MONTH-OVER-MONTH.
Keyboard warriors everywhere will be jumping all over news like this.
What really happened?
The facts:
- Last month, there were 52% fewer sales than in September, 2021.
- The homes that sold last month were 13% smaller than in August.
- The average and median $$-per-sf were higher month-over-month.
There were only 23 sales last month. Fewer sales means more volatility in the data, and the numbers will be bouncing all over the place. The average SP:LP was 97%, so nobody was giving it away, and when you look at sales like the last one on the list on Corte Luisa, know that it was an agent selling his own house for a $980,000 profit above what he paid in 2020.
You have to look deeper into the data to get the full picture of what’s really happening!
~~~~~~~~~~~~~~~~~~~~~~~~~~~~~~~~~~~~~~~~~~
Here are the August and September stats:
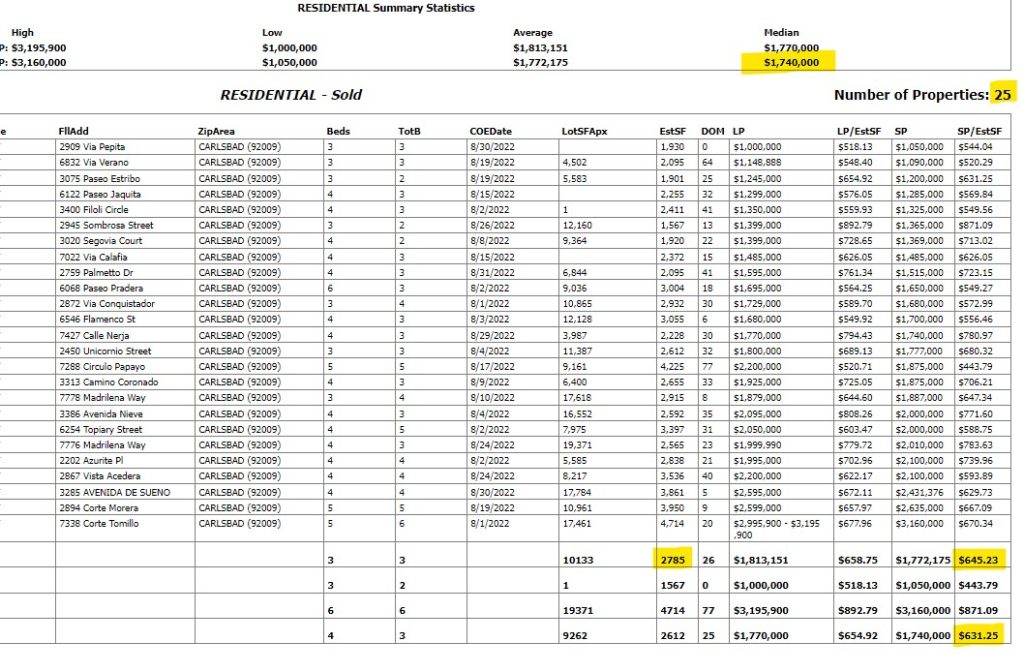
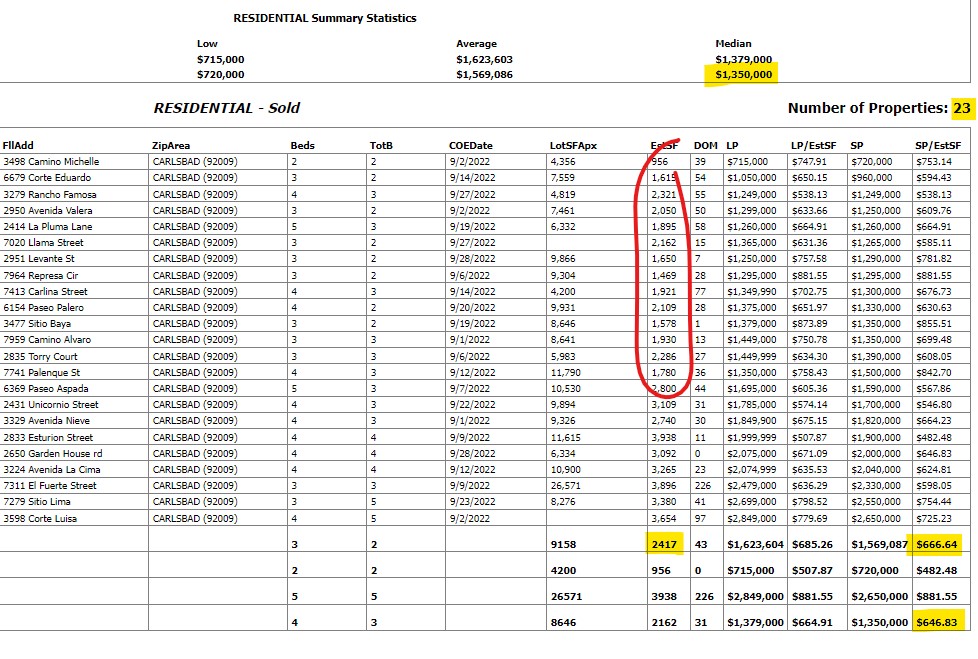
~~~~~~~~~~~~~~~~~~~~~~~~~~~~~~~~~~~~~~~~~~~~
Let’s revisit a previous blog post for an update, and more detail.
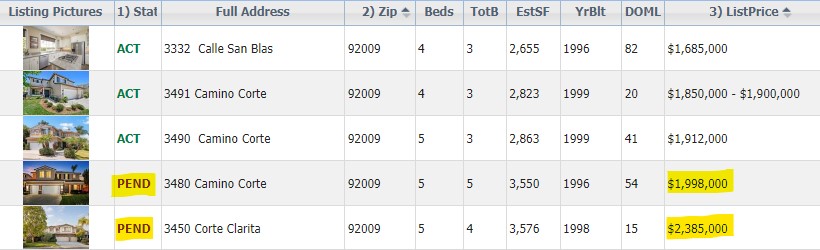
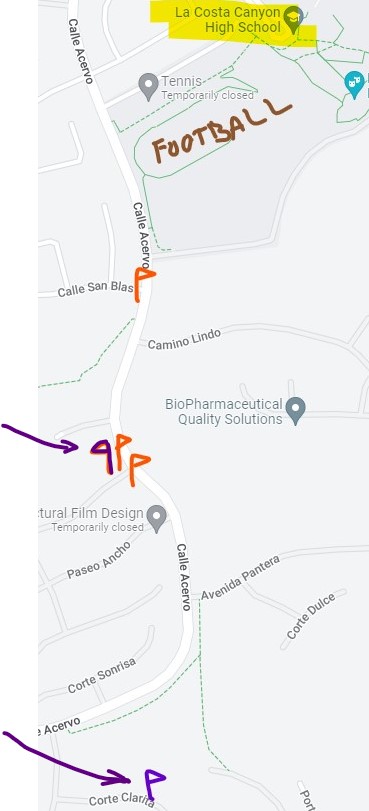
I featured a group of listings near La Costa Canyon HS a couple of weeks ago. The day the blog post ran, the most-expensive listing was pending, but it fell out of escrow that day. It’s back in escrow this week, and judging by how the listing agent ran my rather-sizable nose in it, they must have gotten pretty close to their list price. Tracey sold hers too, and together the two highest-priced listings are the ones that are pending, which demonstrate that buyers want quality and are willing to pay for it.
Pendings = purple:
Realtors who have no game will be reading juicy headlines on social media and be telling their sellers to dump on price, rather than dig for the truth and get to work.
GET GOOD HELP!
And just wait until I tell you the story about this one!
by Jim the Realtor | Sep 21, 2022 | 2022, Over List, Sales and Price Check |
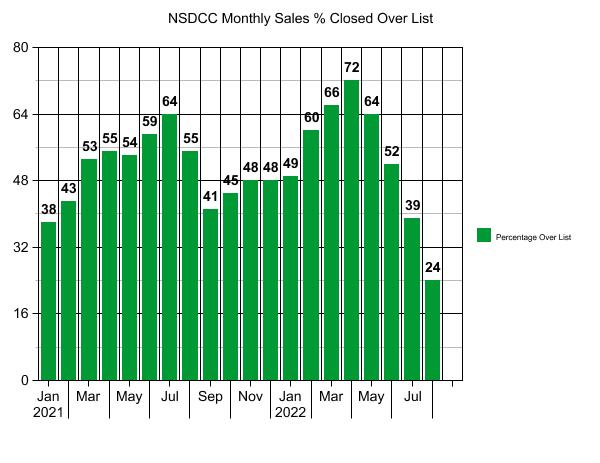
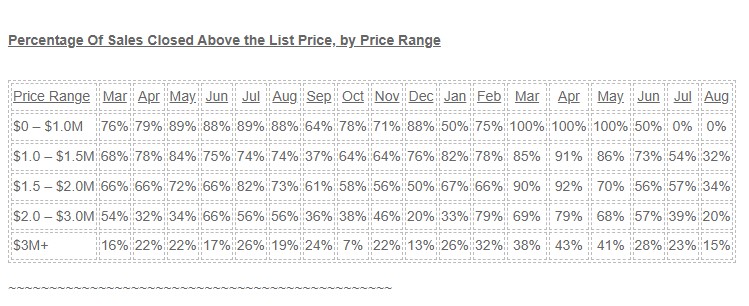
The over-bidding is winding down to more manageable levels as just 24% of August buyers were willing to pay over the list price. As usual, the $1,000,000 to $2,000,000 range was the most active, where inventory is low and the number of quality homes for sale even lower:
The number of sales in August were higher than they were in July, but still well under recent history:
NSDCC August Sales
2018: 275
2019: 263
2020: 351
2021: 268
2020: 161
~~~~~~~~~~~~~~~~~~~~~~~~~~~~~~~~~~~~~~~~~~~~~
NSDCC Average and Median Prices by Month
| Month |
# of Sales |
Avg. LP |
Avg. SP |
Median LP |
Median SP |
| Feb |
224 |
$2,298,797 |
$2,257,334 |
$1,719,500 |
$1,758,000 |
| March |
252 |
$2,295,629 |
$2,260,524 |
$1,800,000 |
$1,825,000 |
| April |
357 |
$2,396,667 |
$2,403,962 |
$1,799,900 |
$1,828,000 |
| May |
300 |
$2,596,992 |
$2,581,715 |
$1,900,000 |
$1,994,500 |
| June |
348 |
$2,509,175 |
$2,537,953 |
$1,900,000 |
$1,967,500 |
| July |
311 |
$2,421,326 |
$2,442,738 |
$1,795,000 |
$1,855,000 |
| Aug |
268 |
$2,415,075 |
$2,438,934 |
$1,897,000 |
$1,950,000 |
| Sept |
278 |
$2,479,440 |
$2,445,817 |
$1,899,000 |
$1,987,500 |
| Oct |
248 |
$2,754,470 |
$2,705,071 |
$1,899,000 |
$1,899,500 |
| Nov |
199 |
$2,713,693 |
$2,707,359 |
$1,999,000 |
$2,100,000 |
| Dec |
189 |
$2,686,126 |
$2,664,391 |
$1,985,000 |
$2,157,500 |
| Jan |
140 |
$2,828,988 |
$2,855,213 |
$2,234,944 |
$2,240,000 |
| Feb |
158 |
$3,063,331 |
$3,108,907 |
$2,149,500 |
$2,386,500 |
| Mar |
207 |
$3,247,251 |
$3,337,348 |
$2,400,000 |
$2,625,000 |
| Apr |
227 |
$3,190,161 |
$3,251,604 |
$2,350,000 |
$2,550,000 |
| May |
214 |
$2,941,080 |
$3,030,794 |
$2,350,000 |
$2,480,000 |
| Jun |
188 |
$2,871,956 |
$2,881,314 |
$2,297,500 |
$2,350,000 |
| Jul |
152 |
$2,892,729 |
$2,833,588 |
$2,272,000 |
$2,280,000 |
| Aug |
161 |
$2,953,967 |
$2,849,332 |
$2,200,000 |
$2,150,000 |
This is much more normal – the average and median sales prices are under their list prices!
by Jim the Realtor | Sep 13, 2022 | North County Coastal, Sales and Price Check |
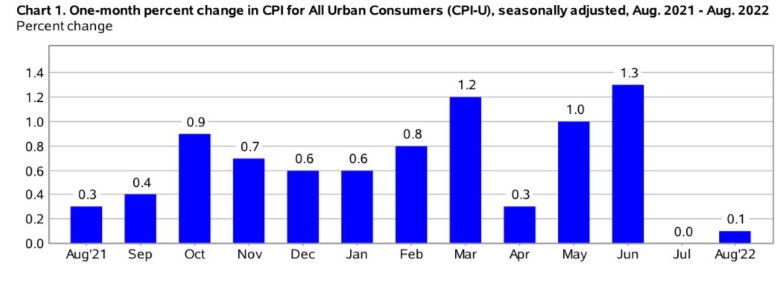
The latest CPI number is out today, and the over-reaction will put more pressure on mortgage rates. They are probably going to be around the 6% range for the foreseeable future.
Let’s predict the NSDCC monthly sales count for the rest of the year.
Today, we have 411 active listings, and we are back to the environment where we can expect that only 60% of those have a chance of selling. It’s probably too late for any active listing to close in September, so let’s sprinkle those 247 probable sales over the next three months, or 82 per month.
There are 152 pendings today, and 111 of those went pending before September 1st. They have released all contingencies on most of those, but let’s say only 100 actually close, and 90 are September closings.
Of the other 41 listings that just went pending, only half of them will close, or 20.
There have been 45 sales already close in September, so adding the two is 90 + 45 = 135 sales this month. Last September we had 269 closings.
NSDCC Monthly Sales, estimated:
September: 135
October: 110
November: 90
December: 90
4Q22 = 290
There will be other new listings over the next three months that will close, and it would be great if every month has 100+ closings – so the above is hopefully the worst-case scenario. But even if we have 300 or more closings in the fourth quarter, look at how that compares to recent NSDCC history:
4Q21 = 636
4Q20 = 977
4Q19 = 681
Even though the month-over-month change in the CPI looks very healthy, the panic will ensue and the real estate markets shut down until February….and probably get off to a slow start then.
People still want to buy, and people still want to sell. Everyone will just be waiting around until February, hoping something will be different!
by Jim the Realtor | Sep 8, 2022 | 2023, Forecasts, Sales and Price Check |
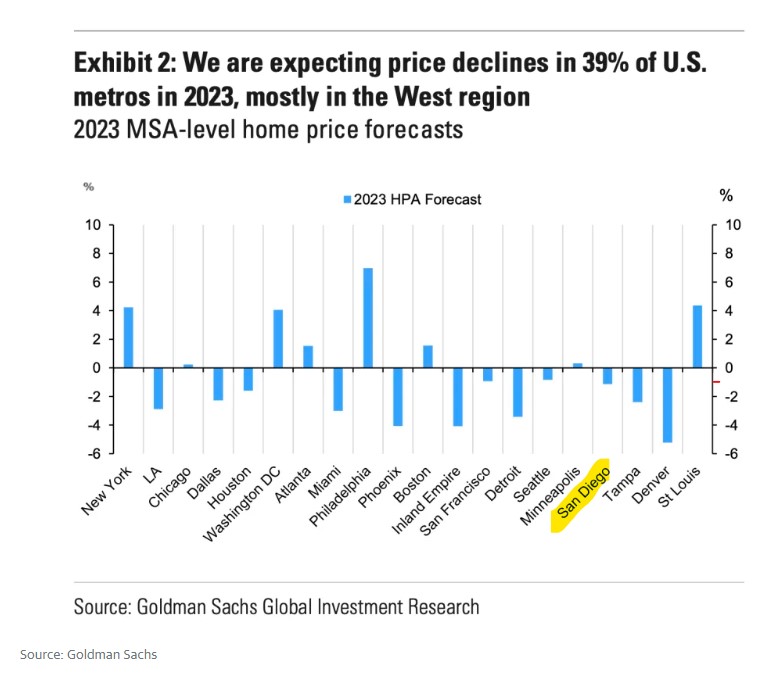
I said: 0% appreciation for NSDCC (La Jolla to Carlsbad) in 2023.
Zillow says: +1.5% to +1.9% for NSDCC.
Goldman Sachs says: -1% for San Diego.
Moody’s has San Diego County home prices changing –3.65% between now and the end of 2023, and then -2.9% by the end of 2024.
What do you say?
Hat tip to shadash for sending this in:
https://finance.yahoo.com/news/home-prices-fall-goldman-sachs-expects-104729829.html
by Jim the Realtor | Sep 4, 2022 | 2023, Sales and Price Check, Thinking of Buying?, Thinking of Selling? |
The wildcard on pricing is that every potential seller has sufficient equity to dump on price if needed.
Why a seller would give it away when there are so many other alternatives (renting, reverse mortgages, hard-money loans, etc.) is beyond me. Even flipper companies like Opendoor (who owns 197 properties in SD County today), have to pay somewhat close to retail to get business.
But there are cases where sellers can, and do, dump on price – like here, where I had the competing listing and we withdrew and rented, rather than give it away:
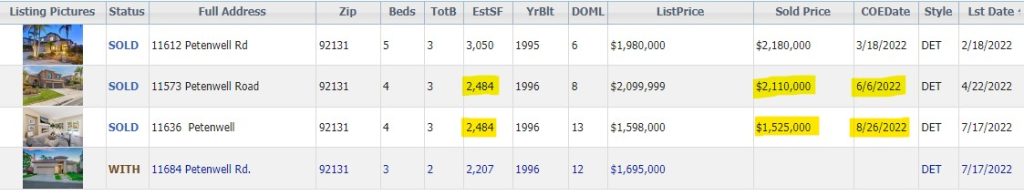
Those sellers paid $875,000 in 2016, so they still left town with a smile on their face – but you can guess that the neighbors didn’t appreciate it. Especially the two who paid over $2,000,000 just months earlier.
It would take a few desperate sellers dumping at the same time to call it a trend.
But if there were enough of those closings sprinkled throughout the county, the median sales price (a terrible measuring device) could fall 10% or more pretty easily.
When looking at 2023 and beyond, you can probably expect that there won’t be many realtors like me that advise sellers to hold out on price. It doesn’t change their paycheck much if they dump and run, and there won’t be anybody in the press or social media sticking up for sellers either.
There is a chance it could get ugly – just because sellers have so much equity that it feels like free money, and they will still walk with hundreds of thousands of dollars, even if they decide to give it away.
by Jim the Realtor | Aug 20, 2022 | Forecasts, Frenzy, Sales and Price Check |

These guys are among the most negative in the business, so if they have San Diego County home prices changing –3.65% between now and the end of 2023, and then -2.9% by the end of 2024, then prices in the better areas will be positive.
The most likely to happen is that we’ll see a few wild sales at the extreme ends, and those will get the headlines. The rest will be +/-5% of the comps. Most will just fumble along – just like during the frenzy – with little or no quality data or advice.
https://fortune.com/2022/08/15/falling-home-prices-to-hit-these-housing-markets-in-2023-and-2024/

by Jim the Realtor | Aug 3, 2022 | North County Coastal, Sales and Price Check |
There will be a few more late-reporters, but it looks like this year’s July sales will be about half of what they were last year:
NSDCC (La Jolla to Carlsbad) July Sales
| Year |
Number of Detached-Home Sales |
Median Sales Price |
Median DOM |
| 2016 |
273 |
$1,100,000 |
45 |
| 2017 |
260 |
$1,243,250 |
19 |
| 2018 |
271 |
$1,280,000 |
27 |
| 2019 |
281 |
$1,300,000 |
22 |
| 2020 |
351 |
$1,423,350 |
17 |
| 2021 |
312 |
$1,852,500 |
12 |
| 2022 |
150 |
$2,268,500 |
16 |
The median sales price was 3% lower than it was in June, but 22% higher than it was last July. A median-priced anything doesn’t give us specific data – it’s only a vague trendline – but it suggests that the higher-priced homes are having more of a struggle finding a buyer.
The declining number of sales does tell us that most sellers are holding out on price (there are 463 active listings with a median list price of $2,999,000). If they are going to sell this year, they need to adjust their price in the next week or two!
I’ll keep this photo handy!

by Jim the Realtor | Aug 2, 2022 | 2022, Carlsbad, Carmel Valley, Encinitas, Graphs of Market Indicators, North County Coastal, Sales and Price Check
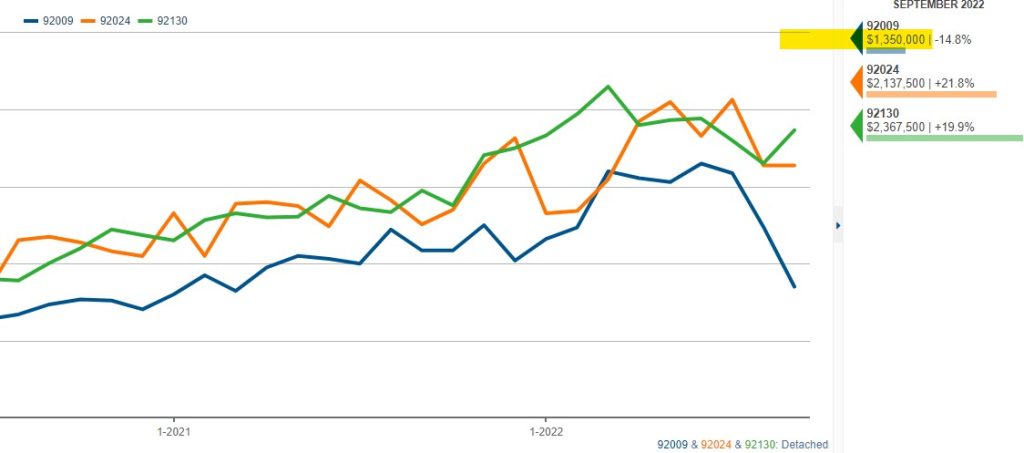
The July stats have been updated on these interactive graphs of the 92009 (SE Carlsbad), 92024 (Encinitas), and 92130 (Carmel Valley) markets:
We hear how the inventory has exploded, but compare it to history:
Sales during the 2022 selling season have been similar to February/March numbers:
It’s good to see the insane-bidding-over-the-list-price has slowed:
We’ve pulled forward about ten years’ worth of appreciation – sellers will be reluctant to give it back:


