by Jim the Realtor | May 28, 2024 | Same-House Sales
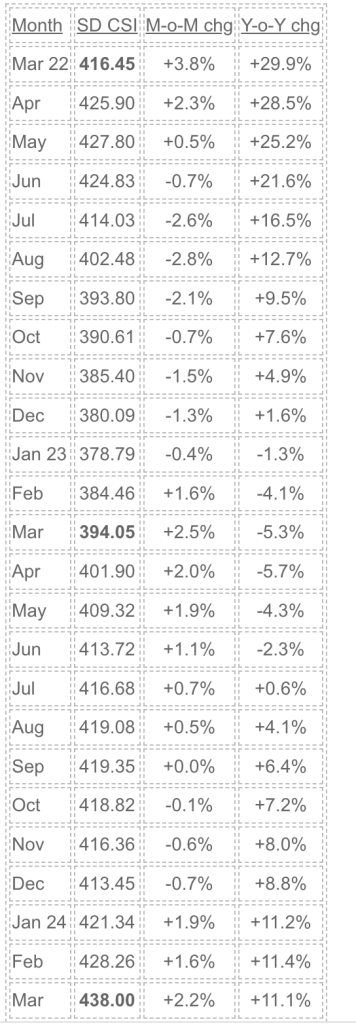
The San Diego Case-Shiller Index is at an all-time high, and it’s 75% higher than it was in November, 2005 which was the peak before the GFC (this blog began in September, 2005).
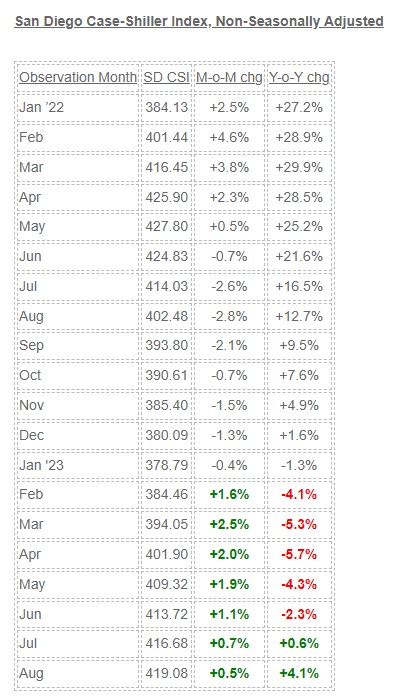
San Diego Case-Shiller Index, Non-Seasonally Adjusted

“This month’s report boasts another all-time high,” says Brian D. Luke of S&P Dow Jones Indices. “We’ve witnessed records repeatedly break in both stock and housing markets over the past year.”
“San Diego stands out with an impressive 11.1% annual gain, followed closely by New York, Cleveland, and Los Angeles, indicating a strong demand for urban markets,” he said.
Prices grew slightly faster in San Francisco and Seattle than in San Diego in March, but those cities’ real estate markets has fallen further, and San Diego remains far ahead over the past 12 months.
by Jim the Realtor | Apr 30, 2024 | Jim's Take on the Market, Same-House Sales |
San Diego Case-Shiller Index, Non-Seasonally Adjusted
| Month |
San Diego CSI |
M-o-M chg |
Y-o-Y chg |
| Jan 22 |
384.13 |
+2.5% |
+27.2% |
| Feb |
401.44 |
+4.6% |
+28.9% |
| Mar |
416.45 |
+3.8% |
+29.9% |
| Apr |
425.90 |
+2.3% |
+28.5% |
| May |
427.80 |
+0.5% |
+25.2% |
| Jun |
424.83 |
-0.7% |
+21.6% |
| Jul |
414.03 |
-2.6% |
+16.5% |
| Aug |
402.48 |
-2.8% |
+12.7% |
| Sep |
393.80 |
-2.1% |
+9.5% |
| Oct |
390.61 |
-0.7% |
+7.6% |
| Nov |
385.40 |
-1.5% |
+4.9% |
| Dec |
380.09 |
-1.3% |
+1.6% |
| Jan 23 |
378.79 |
-0.4% |
-1.3% |
| Feb |
384.46 |
+1.6% |
-4.1% |
| Mar |
394.05 |
+2.5% |
-5.3% |
| Apr |
401.90 |
+2.0% |
-5.7% |
| May |
409.32 |
+1.9% |
-4.3% |
| Jun |
413.72 |
+1.1% |
-2.3% |
| Jul |
416.68 |
+0.7% |
+0.6% |
| Aug |
419.08 |
+0.5% |
+4.1% |
| Sep |
419.35 |
+0.0% |
+6.4% |
| Oct |
418.82 |
-0.1% |
+7.2% |
| Nov |
416.36 |
-0.6% |
+8.0% |
| Dec |
413.45 |
-0.7% |
+8.8% |
| Jan 24 |
421.34 |
+1.9% |
+11.2% |
| Feb |
428.26 |
+1.6% |
+11.4% |
The local Case-Shiller Index is back to the peak of May, 2022!
The next two readings will likely be +2.0% month-over-month.
The 20- City Composite posted a year-over-year increase of 7.3%, up from a 6.6% increase in the previous month. San Diego continued to report the highest year-over-year gain among the 20 cities with an 11.4% increase in February, followed by Chicago and Detroit , with an increase of 8.9%. Portland, though still holding the lowest rank after reporting two consecutive months of the smallest year-over-year growth, had a significant increase in annual gain of 2.2% in February.
by Jim the Realtor | Mar 26, 2024 | 2024, Jim's Take on the Market, Same-House Sales

San Diego Case-Shiller Index, Non-Seasonally Adjusted
| Month |
SD CSI |
M-o-M chg |
Y-o-Y chg |
| Jan 22 |
384.13 |
+2.5% |
+27.2% |
| Feb |
401.44 |
+4.6% |
+28.9% |
| Mar |
416.45 |
+3.8% |
+29.9% |
| Apr |
425.90 |
+2.3% |
+28.5% |
| May |
427.80 |
+0.5% |
+25.2% |
| Jun |
424.83 |
-0.7% |
+21.6% |
| Jul |
414.03 |
-2.6% |
+16.5% |
| Aug |
402.48 |
-2.8% |
+12.7% |
| Sep |
393.80 |
-2.1% |
+9.5% |
| Oct |
390.61 |
-0.7% |
+7.6% |
| Nov |
385.40 |
-1.5% |
+4.9% |
| Dec |
380.09 |
-1.3% |
+1.6% |
| Jan 23 |
378.79 |
-0.4% |
-1.3% |
| Feb |
384.46 |
+1.6% |
-4.1% |
| Mar |
394.05 |
+2.5% |
-5.3% |
| Apr |
401.90 |
+2.0% |
-5.7% |
| May |
409.32 |
+1.9% |
-4.3% |
| Jun |
413.72 |
+1.1% |
-2.3% |
| Jul |
416.68 |
+0.7% |
+0.6% |
| Aug |
419.08 |
+0.5% |
+4.1% |
| Sep |
419.35 |
+0.0% |
+6.4% |
| Oct |
418.82 |
-0.1% |
+7.2% |
| Nov |
416.36 |
-0.6% |
+8.0% |
| Dec |
413.45 |
-0.7% |
+8.8% |
| Jan 24 |
421.34 |
+1.9% |
+11.2% |
It has felt like prices have been surging this year, and here is more evidence. The record high was 427.80 in May, 2022, and it should be back to that level by the next reading.
We’re in the midst of all-time record-high pricing today!
by Jim the Realtor | Feb 27, 2024 | Same-House Sales
After mortgage rates went up in 2022, the local Case-Shiller Index was jarred with a 12.1% drop over the subsequent eight months. The end of 2023 held up much better, logging only a slight decline of -1.4% in the last three months of the year:

The S&P CoreLogic Case-Shiller U.S. National Home Price NSA Index, covering all nine U.S. census divisions, reported a 5.5% annual gain in December, up from a 5.0% rise in the previous month. The 10-City Composite showed an increase of 7.0%, up from a 6.3% increase in the previous month. The 20-City Composite posted a year-over-year increase of 6.1%, up from a 5.4% increase in the previous month.
San Diego reported the highest year-over-year gain among the 20 cities with an 8.8% increase in December, followed by Los Angeles and Detroit, each with an 8.3% increase. Portland showed a 0.3% increase this month, holding the lowest rank after reporting the smallest year-over-year growth.
“U.S. home prices faced significant headwinds in the fourth quarter of 2023,” says Brian D. Luke, Head of Commodities, Real & Digital Assets at S&P Dow Jones Indices. “However, on a seasonally adjusted basis, the S&P Case-Shiller Home Price Indices continued its streak of seven consecutive record highs in 2023.”
“2023 U.S. housing gains haven’t followed such a synchronous pattern since the COVID housing boom. The term ‘a rising tide lifts all boats’ seems appropriate given broad-based performance in the U.S. housing sector. All 20 markets reported yearly gains for the first time this year, with four markets rising over 8%. Portland eked out a positive annual gain after 11 months of declines. Regionally, the Midwest and Northeast both experienced the greatest annual appreciation with 6.7%.”
by Jim the Realtor | Jan 30, 2024 | Same-House Sales |

After seasonal adjustment, the U.S. National Index and the 10-City Composite posted month-over-month increases of 0.2%, while the 20-City Composite posted a month-over-month increase of 0.1%.
“U.S. home prices edged downward from their all-time high in November,” says Brian D. Luke, Head of Commodities, Real & Digital Assets at S&P DJI. “The streak of nine monthly gains ended in November, setting the index back to levels last seen over the summer months. Seattle and San Francisco reported the largest monthly declines, falling 1.4% and 1.3%, respectively.”
“November’s year-over-year gain saw the largest growth in U.S. home prices in 2023, with our National Composite rising 5.1% and the 10-city index rising 6.2%. Detroit held its position as the best performing market for the third month in a row, accelerating to an 8.2% gain. San Diego notched an 8% annual gain, retaining its second spot in the nation. Barring a late surge from another market, those cities will vie for the ‘housing market of the year’ as the best performing city in our composite.”
“Six cities registered a new all-time high in November (Miami, Tampa, Atlanta, Charlotte, New York, and Cleveland). Portland remains the lone market in annual decline. The Northeast and Midwest recorded the largest gains with returns of 6.4% and 6.3%, respectively. Other regions are not far behind with the slowest gains in the West of 3%. This month’s report revealed the narrowest spread of performance across the nation since the first quarter of 2021.”
~~~~~~~~~~~~~~~~~~~~~~~~~~~~~~~~~~~~~~~~~~~~~~~~~~~~~~
The decline in the local index is picking up speed, but it’s not falling as fast as it was last year.
Who cares – September, October, and November were forever ago.
Either a house has been improved to sell and gets a lot of attention, or it sits.
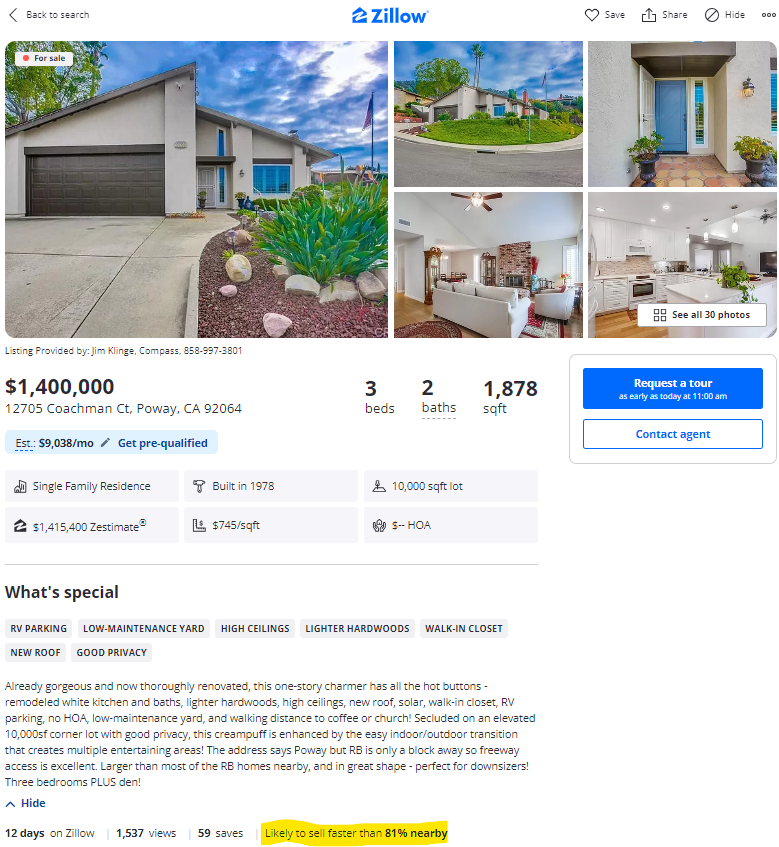
Take our listing here:

Judging by the statistics, Zillow thinks this house should sell fast, a smaller house down the street just had seven offers and sold over $1,400,000, and we are up to NINE offers on our similarly-priced new listing. But here the owner refused to do staging, in spite of our recommendation – and they have bought and sold three other houses with us!
The impact? Only two people came to the open house on Saturday, and we haven’t sniffed an offer.
Buyers don’t have the vision or patience to imagine what a house could be – they are attracted to those homes who have already done the work for them. At these prices, you can’t blame them!
by Jim the Realtor | Dec 26, 2023 | Same-House Sales |
Last year, the index was falling faster than this year (another good sign going into 2024). There might be some noise in the next three readings, but the second half of 2023 should wind up flat at worst.
The index dropped 11% in the second half of 2022, and currently the second half of 2023 is +1.1%.

The October index is 2% below the all-time high in May, 2022, and is +68% from when this blog started!
by Jim the Realtor | Nov 28, 2023 | 2024, Forecasts, Jim's Take on the Market, Same-House Sales, Why You Should List With Jim |

Ok, ok – yesterday I said that we’re at the highest pricing ever, but the San Diego non-seasonally-adjusted Case-Shiller Index isn’t quite there yet.
But it feels like record pricing around the north county coastal region, doesn’t it?
The index dropped eight months in a row last year, and it might track negatively over the next few readings of 2023 – big whoop. The index gave back 11% last year, and we’ve regained all but 2% of it this year. It is a seasonal event that will probably repeat in the coming years.
If the pricing keeps trending upward in 2024, at least it should be somewhat offset by lower mortgage rates this time. The quick rise in rates in the middle to late 2022 had to be reflected in the pricing, which it was. But this year, pricing held up nicely in spite of touching 8% rates recently.
I’m predicting an increase in listings next year, and it could amount to a full-blown surge. I already have three listings lined up for early-2024, which has never happened this early – there have been years where I get well into January without sniffing a new listing!
I’ll survey my fellow agents over the next couple of weeks to see what they say – two have already agreed!
by Jim the Realtor | Oct 31, 2023 | Same-House Sales
The local index increased to 419.08 in August, and is angling towards the all-time high of 427.80 reached in May, 2022. Even if the increases slow the rest of the year, we should get back into record territory by the time the 2024 home-selling season begins.

The San Diego index dropped 11% between May, 2022 and January, 2023, and has risen 11% since!
by Jim the Realtor | Sep 26, 2023 | Forecasts, Realtor Post-Frenzy Playbook, Same-House Sales

The local index is about where it was last month AND last year at this time.
It is 3% below the peak of last May, and +9.6% year-to-date.
It wouldn’t surprise me if it slides downward ~3% the rest of 2023, then up ~3% in the first half of 2024, then down ~3% in the second half of 2024….recession or not.
Because rates won’t be going down until 2025 (at least), pricing should stay rangebound. Without wild swings in pricing, the buyers can focus on finding the perfect home without compromise.
When there are bidding wars and rapidly-rising prices, buyers are prone to just grabbing something and paying whatever it takes. Without those, sellers and agents have to be really good at selling homes – which hasn’t been required over the last several years.

by Jim the Realtor | Aug 31, 2023 | Market Surge, Same-House Sales

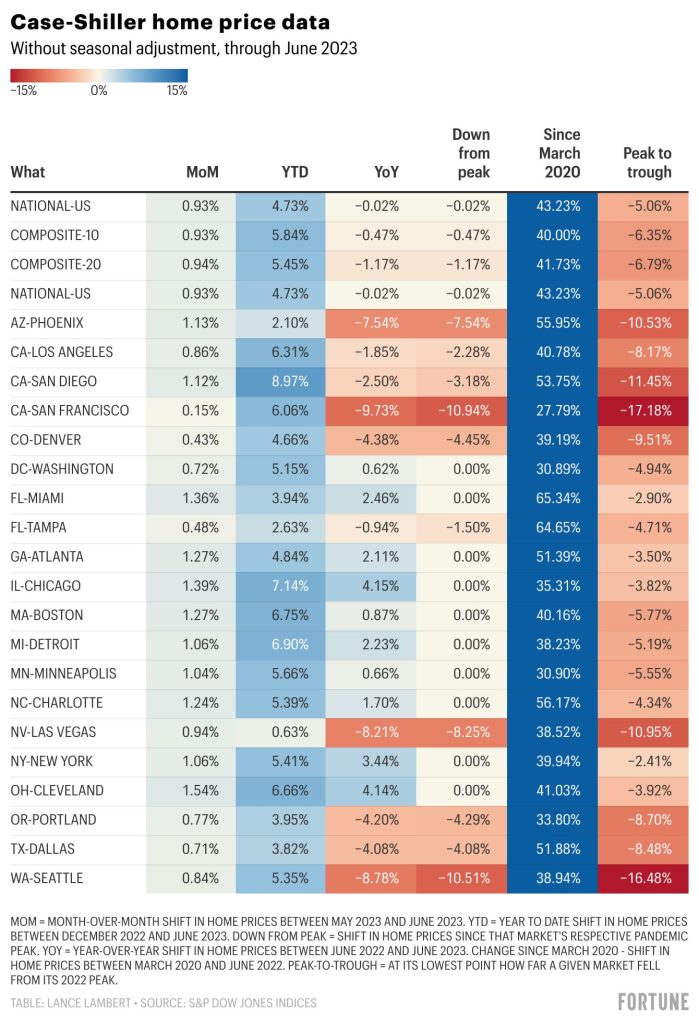
The San Diego Case-Shiller index has the largest YTD increase in America, and is the only higher-end market with a 50%-plus increase since March, 2020!
A whopping 53.75% increase in three-and-a-half years!


