by Jim the Realtor | Jan 26, 2021 | Frenzy, Sales and Price Check, Same-House Sales |
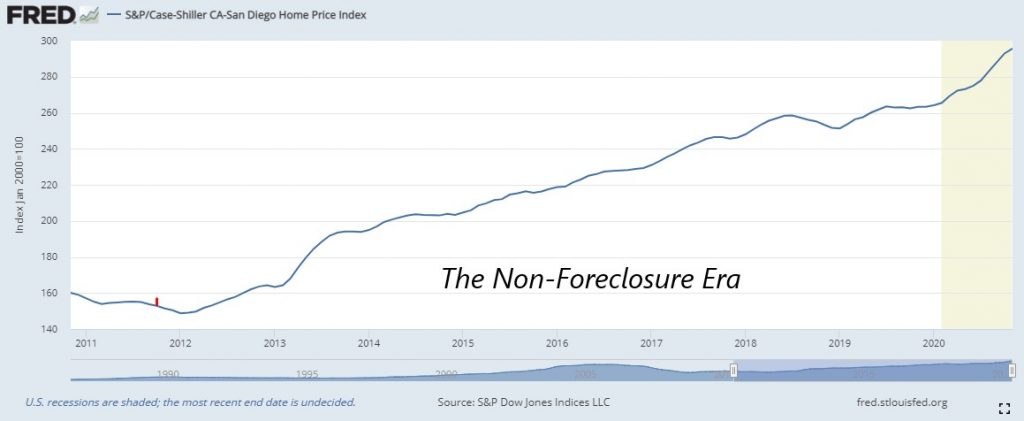
It was in June, 2011 that Ben Bernanke said at a live press conference: We have told the banks to handle their REOs…..long pause………..in an economy-supportive way. Oops. What he was GOING to say was “we have told the banks not to flood the market with REOs.”
Since then, foreclosures dried up, mortgage rates came down, and the local home prices have gone up steadily. Today’s pricing curve looks similar to 2013 – if it repeats, then prices should flatten out this summer. But who knows – there is heavy demand, and few sellers have been lured by these prices!
San Diego Non-Seasonally-Adjusted CSI changes:
| Observation Month |
SD CSI |
M-o-M chg |
Y-o-Y chg |
| January ’19 |
251.30 |
-0.2% |
+1.3% |
| Feb |
253.69 |
+0.9% |
+1.1% |
| Mar |
256.40 |
+1.1% |
+1.2% |
| Apr |
257.63 |
+0.5% |
+0.8% |
| May |
260.08 |
+1.0% |
+1.1% |
| June |
261.90 |
+0.7% |
+1.3% |
| July |
263.66 |
+0.7% |
+2.0% |
| Aug |
263.23 |
-0.2% |
+2.3% |
| Sep |
263.26 |
0% |
+2.8% |
| Oct |
262.56 |
-0.2% |
+2.7% |
| Nov |
263.18 |
+0.2% |
+3.9% |
| Dec |
263.51 |
+0.1% |
+4.7% |
| Jan ’20 |
264.04 |
+0.2% |
+5.1% |
| Feb |
265.34 |
+0.5% |
+4.6% |
| Mar |
269.63 |
+1.6% |
+5.2% |
| Apr |
272.48 |
+1.1% |
+5.8% |
| May |
273.51 |
+0.4% |
+5.2% |
| June |
274.91 |
+0.5% |
+5.0% |
| July |
278.00 |
+1.1% |
+5.4% |
| Aug |
283.06 |
+1.8% |
+7.6% |
| Sep |
288.11 |
+1.8% |
+9.4% |
| Oct |
292.85 |
+1.6% |
+11.5% |
| Nov |
295.64 |
+1.0% |
+12.3% |
From cnbc:
Phoenix, Seattle and San Diego continued to show the strongest price appreciation of all the major markets in November. Phoenix led the way with a 13.8% year-over-year price increase, followed by Seattle with a 12.7% increase and San Diego with a 12.3% increase. All 19 cities reported higher price increases in the year ending November versus the end of October.
“Our 2021 outlook expects an eventual moderation to price gains as home construction ramps up and the widespread availability of COVID vaccines bring more flexible sellers back to the housing market, but it will be some time before these changes bring relief,” said Danielle Hale, chief economist with realtor.com.
https://www.cnbc.com/2021/01/26/november-home-prices-rose-9point5percent-one-of-the-highest-gains-on-record-case-shiller-says.html
~~~~~~~~~~~~~~~~~~~~~~~~~~~~~~~~~~
by Jim the Realtor | Dec 29, 2020 | 2021, Forecasts, Frenzy, Jim's Take on the Market, Sales and Price Check, Same-House Sales |
Bill has his annual forecast on home prices here:
https://www.calculatedriskblog.com/2020/12/question-8-for-2021-what-will-happen.html
Here is a snapshot of the forecasts:
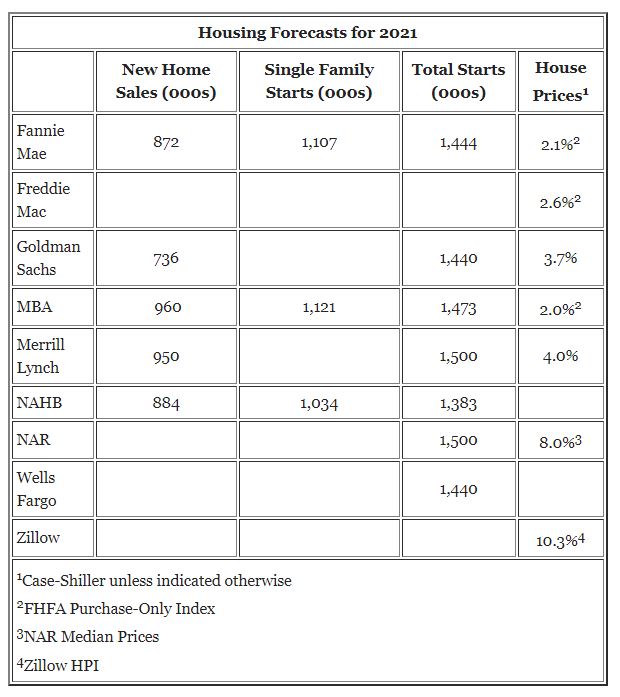
(I was reading the previous chart wrong when I said that all were forecasting 7% to 10% appreciation. This is the accurate chart, with the old fuddy-duddies still lagging behind in the safety zone of 2% to 3%)
THE FRENZY IS COMING!
~~~~~~~~~~~~~~~~~~~~~~~~~~~~~~~~
by Jim the Realtor | Dec 29, 2020 | Same-House Sales
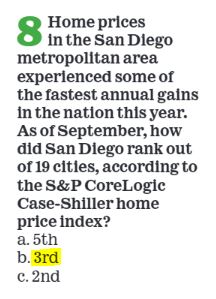
Because our market at the end of 2019 was so flat (December’s index was lower than July’s), the year-over-year gains are going to make for sexy double-digit headlines for the next couple of readings.
San Diego Non-Seasonally-Adjusted CSI changes:
| Observation Month |
SD CSI |
M-o-M chg |
Y-o-Y chg |
| January ’19 |
251.30 |
-0.2% |
+1.3% |
| Feb |
253.69 |
+0.9% |
+1.1% |
| Mar |
256.40 |
+1.1% |
+1.2% |
| Apr |
257.63 |
+0.5% |
+0.8% |
| May |
260.08 |
+1.0% |
+1.1% |
| June |
261.90 |
+0.7% |
+1.3% |
| July |
263.66 |
+0.7% |
+2.0% |
| Aug |
263.23 |
-0.2% |
+2.3% |
| Sep |
263.26 |
0% |
+2.8% |
| Oct |
262.56 |
-0.2% |
+2.7% |
| Nov |
263.18 |
+0.2% |
+3.9% |
| Dec |
263.51 |
+0.1% |
+4.7% |
| Jan ’20 |
264.04 |
+0.2% |
+5.1% |
| Feb |
265.34 |
+0.5% |
+4.6% |
| Mar |
269.63 |
+1.6% |
+5.2% |
| Apr |
272.48 |
+1.1% |
+5.8% |
| May |
273.51 |
+0.4% |
+5.2% |
| June |
274.91 |
+0.5% |
+5.0% |
| July |
278.00 |
+1.1% |
+5.4% |
| Aug |
283.06 |
+1.8% |
+7.6% |
| Sep |
288.11 |
+1.8% |
+9.4% |
| Oct |
292.85 |
+1.6% |
+11.5% |
From cnbc:
U.S. home prices jumped in October by the most in more than six years as a pandemic-fueled buying rush drives the number of available properties for sale to record lows.
The biggest price gain was in Phoenix for the 17th straight month, where home prices rose 12.7% from a year ago. It was followed by Seattle with 11.7% and San Diego at 11.6%.
https://www.cnbc.com/2020/12/29/us-home-prices-rise-at-fastest-pace-in-more-than-6-years-.html
~~~~~~~~~~~~~~~~~~~~~~~~~~~~~~~~~~~
by Jim the Realtor | Nov 28, 2020 | Carlsbad, Frenzy, Jim's Take on the Market, Market Conditions, Same-House Sales, Why You Should Hire Jim as your Buyer's Agent |
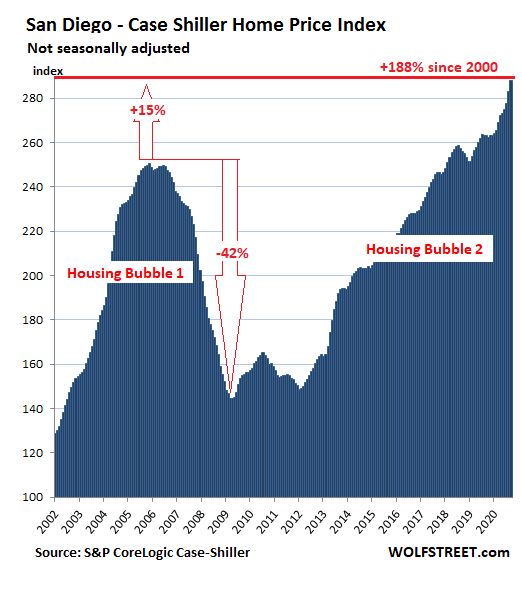
The 15% increase from the last peak 15 years ago doesn’t seem bad, though both were bubblelicious thanks to stimulus (exotic financing then and ultra-low rates today).
https://wolfstreet.com/2020/11/24/the-most-splendid-housing-bubbles-in-america-november-update/
The big difference is that the last bubble was built on the backs of the the under-qualified borrowers who took exotic mortgages from unscrupulous loan brokers. The bad loans were funneled to Wall Street, where the same thing happened – the Tan Man took advantage of greedy but unknowing financiers and the combined effect exposed the house of cards. Without the end users making their payments, the machine came to a grinding halt.
Could it happen again?
Because mortgage underwriting has been strict over the last ten years, it’s hard to imagine that a wave of homeowners loaded with equity would get foreclosed – and then the banks would give them away too.
But it is possible that we could have mild swings of 5% to 10%. But if there were a couple of low sales, wouldn’t the lower-motivated sellers just wait it out? Probably.
Here’s a recent example we can follow – I think we can call this a low sale:

1756 Skimmer Ct., Carlsbad, CA 92011
4 br/2.5 ba, 2,409sf one-story with 3-car garage on a 10,041sf lot.
LP = $1,328,000 on September 10, 2020
SP = $1,000,000 on November 17, 2020.
The home had been on the market for a couple of months and it was time – the seller was ready to move! My buyers offered the right price, on the right day, and the seller signed it.
It’s a classic example of finding a long-time owner who could sell for less and still walk away with a bucketful of money. The seller paid $430,000 when the home was new in 2001. They didn’t put in any upgrades then or now – it was the original carpet and paint, etc., they made no attempt to improve the property for sale:
https://www.compass.com/listing/1756-skimmer-court-carlsbad-ca-92011/603767865654710185/
The thing to appreciate about this home is that it backs to dedicated open space, where the other side of the street backs to Poinsettia, a four-laner which will soon be connected to the I-5 off-ramp about a mile away. My buyers benefit from easier access but no noticeable road noise!

New bridge in red
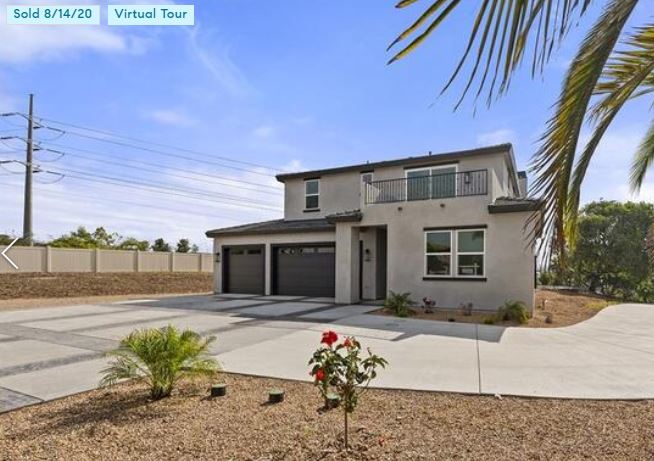
The last two sales of this model were $910,000 and $935,000 in 2017 (does anybody want to pay within 10% of 2017 prices today – yeah!). The last sale on this street was a newly-built 3,380sf home at the end of the street that sold for $1,380,000 in August. It was in the shadow of the power lines, and backed to El Camino Real/Poinsettia intersection with substantial road noise:
Here are the one-story homes sold in the last six months – they average $533/sf, and we closed at $415/sf:
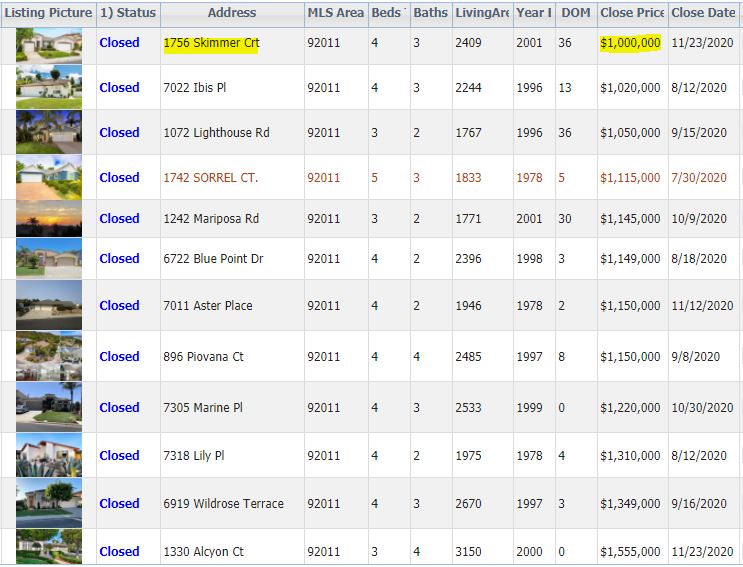

Yes, I’m tooting my own horn for being the agent who recognized that this home was languishing on the market, had an original owner and would be a candidate to sell for less.
But will I be the villian who started the Big Downturn in the 92011? No, every other one-story-home seller nearby will shrug this off and list for at least $500/sf in the foreseeable future.
by Jim the Realtor | Nov 24, 2020 | Frenzy, Jim's Take on the Market, Sales and Price Check, Same-House Sales
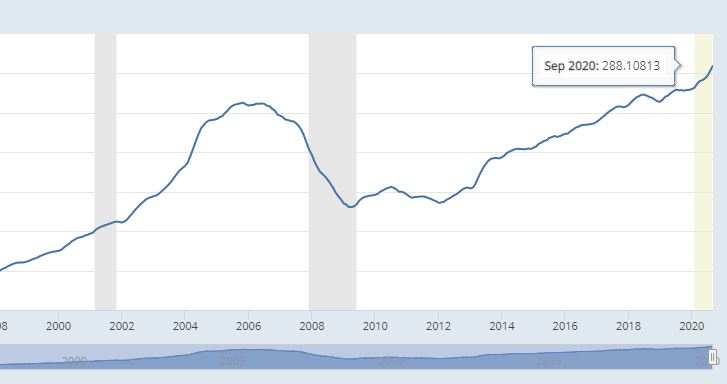
What a difference compared to the second half of 2019:
San Diego Non-Seasonally-Adjusted CSI changes:
| Observation Month |
SD CSI |
M-o-M chg |
Y-o-Y chg |
| January ’19 |
251.30 |
-0.2% |
+1.3% |
| Feb |
253.69 |
+0.9% |
+1.1% |
| Mar |
256.40 |
+1.1% |
+1.2% |
| Apr |
257.63 |
+0.5% |
+0.8% |
| May |
260.08 |
+1.0% |
+1.1% |
| June |
261.90 |
+0.7% |
+1.3% |
| July |
263.66 |
+0.7% |
+2.0% |
| Aug |
263.23 |
-0.2% |
+2.3% |
| Sep |
263.26 |
0% |
+2.8% |
| Oct |
262.56 |
-0.2% |
+2.7% |
| Nov |
263.18 |
+0.2% |
+3.9% |
| Dec |
263.51 |
+0.1% |
+4.7% |
| Jan ’20 |
264.04 |
+0.2% |
+5.1% |
| Feb |
265.34 |
+0.5% |
+4.6% |
| Mar |
269.63 |
+1.6% |
+5.2% |
| Apr |
272.48 |
+1.1% |
+5.8% |
| May |
273.51 |
+0.4% |
+5.2% |
| June |
274.91 |
+0.5% |
+5.0% |
| July |
278.00 |
+1.1% |
+5.4% |
| Aug |
283.06 |
+1.8% |
+7.6% |
| Sep |
288.11 |
+1.8% |
+9.4% |
If we can sustain the monthly 1.8% increase x 12 = 21.6%.
From cnbc:
This index is a three-month running average, so it represents prices from July through September, when buyers were eagerly seeking homes with more space for working and schooling at home due to the coronavirus.
“Housing prices were notably – I am tempted to say ‘very’ – strong in September,” said Craig J. Lazzara, managing director and global head of index investment strategy at S&P Dow Jones Indices. “This month’s increase may reflect a catch-up of COVID-depressed demand from earlier this year; it might also presage future strength, as COVID encourages potential buyers to move from urban apartments to suburban homes. The next several months’ reports should help to shed light on this question.”
Phoenix, Seattle and San Diego continued to see the highest annual gains among the 19 cities (excluding Detroit) in September. Home prices in Phoenix rose 11.4% year over year, followed by Seattle with a 10.1% increase and San Diego with a 9.5% increase.
https://www.cnbc.com/2020/11/24/home-prices-see-biggest-spike-in-6-years-in-september.html
~~~~~~~~~~~~~~~~~~~~~~~~~~~~~~~~~~~~~~~~~
by Jim the Realtor | Oct 27, 2020 | Jim's Take on the Market, Same-House Sales
What a difference compared to the second half of 2019:
San Diego Non-Seasonally-Adjusted CSI changes:
| Observation Month |
SD CSI |
M-o-M chg |
Y-o-Y chg |
| January ’19 |
251.30 |
-0.2% |
+1.3% |
| Feb |
253.69 |
+0.9% |
+1.1% |
| Mar |
256.40 |
+1.1% |
+1.2% |
| Apr |
257.63 |
+0.5% |
+0.8% |
| May |
260.08 |
+1.0% |
+1.1% |
| June |
261.90 |
+0.7% |
+1.3% |
| July |
263.66 |
+0.7% |
+2.0% |
| Aug |
263.23 |
-0.2% |
+2.3% |
| Sep |
263.26 |
0% |
+2.8% |
| Oct |
262.56 |
-0.2% |
+2.7% |
| Nov |
263.18 |
+0.2% |
+3.9% |
| Dec |
263.51 |
+0.1% |
+4.7% |
| Jan ’20 |
264.04 |
+0.2% |
+5.1% |
| Feb |
265.34 |
+0.5% |
+4.6% |
| Mar |
269.63 |
+1.6% |
+5.2% |
| Apr |
272.48 |
+1.1% |
+5.8% |
| May |
273.51 |
+0.4% |
+5.2% |
| June |
274.91 |
+0.5% |
+5.0% |
| July |
278.00 |
+1.1% |
+5.4% |
| Aug |
283.06 |
+1.8% |
+7.6% |
Last month I said, “Will the September & October indices hit 2.0%? Likely!”
From cnbc.com:
“A trend of accelerating increases in the National Composite Index began in August 2019 but was interrupted in May and June, as Covid-related restrictions produced modestly-decelerating price gains,” said Craig Lazzara, managing director and global head of Index Investment Strategy at S&P Dow Jones Indices.
“The last time that the National Composite matched August’s 5.7% growth rate was 25 months ago, in July 2018. If future reports continue in this vein, we may soon be able to conclude that the Covid-related deceleration is behind us. ”
Phoenix, Seattle and San Diego reported the highest annual gains among the 19 cities (excluding Detroit) in August. Phoenix led the way with a 9.9% price increase, followed by Seattle with an 8.5% increase and San Diego with a 7.6% increase.
Chicago, New York City and San Francisco saw the smallest annual home price gains in August.
S&P Case-Shiller is a repeat sales index, running on a three-month average; it measures the sale prices of similar homes over time. Other home price indexes, like the measure from the National Association of Realtors, show much higher price gains because they calculate the median price of all homes sold during the month.
Since there is currently much more sales activity on the higher end of the market, where there is more supply available, that is skewing the median price much higher. The Realtors reported a 15% annual price gain for September.
Prices are being fueled not just by strong demand but by record low mortgage rates. Rates set several new records over the summer and continued to do so in September as well. Low mortgage rates give buyers more purchasing power, allowing sellers to raise prices.
https://www.cnbc.com/2020/10/27/home-prices-rise-at-.html
by Jim the Realtor | Sep 29, 2020 | Jim's Take on the Market, Same-House Sales
The July reading includes some data from May and June, so we’re getting through the negative covid impact, and swinging into the positive! The next 2-3 readings should be at least this high:
San Diego Non-Seasonally-Adjusted CSI changes:
| Observation Month |
SD CSI |
M-o-M chg |
Y-o-Y chg |
| January ’19 |
251.30 |
-0.2% |
+1.3% |
| Feb |
253.69 |
+0.9% |
+1.1% |
| Mar |
256.40 |
+1.1% |
+1.2% |
| Apr |
257.63 |
+0.5% |
+0.8% |
| May |
260.08 |
+1.0% |
+1.1% |
| June |
261.90 |
+0.7% |
+1.3% |
| July |
263.66 |
+0.7% |
+2.0% |
| Aug |
263.23 |
-0.2% |
+2.3% |
| Sep |
263.26 |
0% |
+2.8% |
| Oct |
262.56 |
-0.2% |
+2.7% |
| Nov |
263.18 |
+0.2% |
+3.9% |
| Dec |
263.51 |
+0.1% |
+4.7% |
| Jan ’20 |
264.04 |
+0.2% |
+5.1% |
| Feb |
265.34 |
+0.5% |
+4.6% |
| Mar |
269.63 |
+1.6% |
+5.2% |
| Apr |
272.48 |
+1.1% |
+5.8% |
| May |
273.51 |
+0.4% |
+5.2% |
| June |
274.91 |
+0.5% |
+5.0% |
| July |
278.00 |
+1.1% |
+5.4% |
Will the September & October indices hit 2.0%? Likely!
by Jim the Realtor | Aug 27, 2020 | Jim's Take on the Market, Same-House Sales |
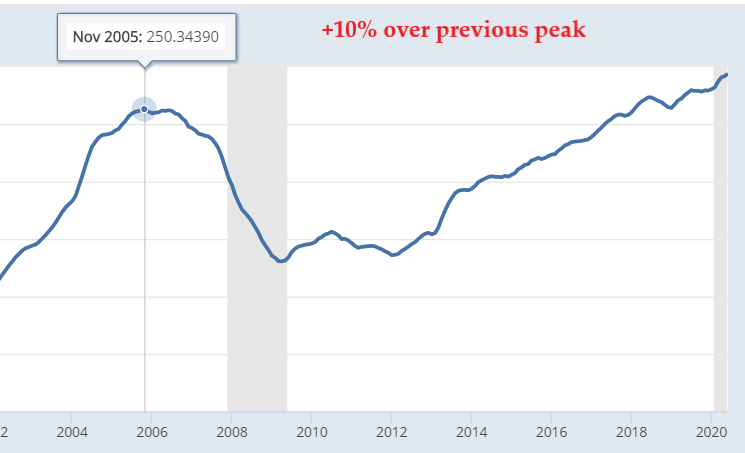
I’ve been pedaling so fast these days, I forgot all about the Case-Shiller Index on Tuesday:
San Diego Non-Seasonally-Adjusted CSI changes:
| Observation Month |
SD CSI |
M-o-M chg |
Y-o-Y chg |
| January ’19 |
251.30 |
-0.2% |
+1.3% |
| Feb |
253.69 |
+0.9% |
+1.1% |
| Mar |
256.40 |
+1.1% |
+1.2% |
| Apr |
257.63 |
+0.5% |
+0.8% |
| May |
260.08 |
+1.0% |
+1.1% |
| June |
261.90 |
+0.7% |
+1.3% |
| July |
263.66 |
+0.7% |
+2.0% |
| Aug |
263.23 |
-0.2% |
+2.3% |
| Sep |
263.26 |
0% |
+2.8% |
| Oct |
262.56 |
-0.2% |
+2.7% |
| Nov |
263.18 |
+0.2% |
+3.9% |
| Dec |
263.51 |
+0.1% |
+4.7% |
| Jan ’20 |
264.04 |
+0.2% |
+5.1% |
| Feb |
265.34 |
+0.5% |
+4.6% |
| Mar |
269.63 |
+1.6% |
+5.2% |
| Apr |
272.48 |
+1.1% |
+5.8% |
| May |
273.51 |
+0.4% |
+5.2% |
| June |
274.91 |
+0.5% |
+5.0% |
The corona might have slowed down pricing a tad, but with the ultra-low rates, we should be back to 1.0% monthly increases over the next few readings.
by Jim the Realtor | Jul 28, 2020 | Jim's Take on the Market, Same-House Sales |
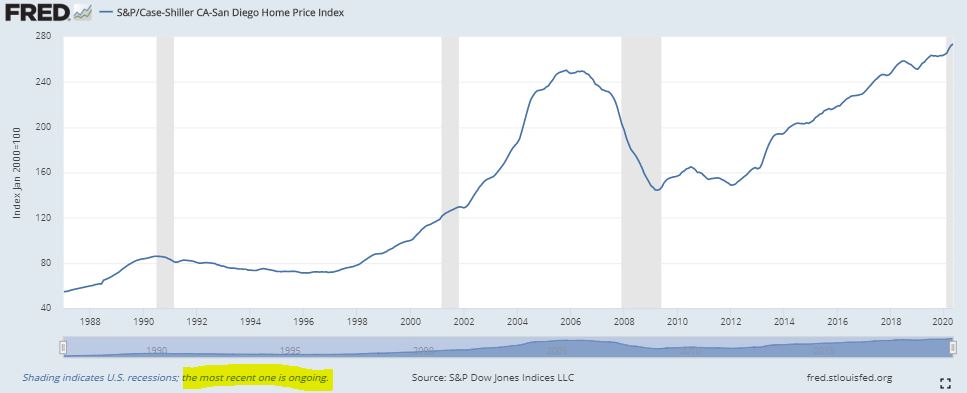
The index in May and June might ‘decelerate’, but the usual seasonal surge in our Case-Shiller Index should be delayed this year. The index is hitting all-time highs while we are in a recession, officially!
San Diego Non-Seasonally-Adjusted CSI changes:
| Observation Month |
SD CSI |
M-o-M chg |
Y-o-Y chg |
| January ’19 |
251.30 |
-0.2% |
+1.3% |
| Feb |
253.69 |
+0.9% |
+1.1% |
| Mar |
256.40 |
+1.1% |
+1.2% |
| Apr |
257.63 |
+0.5% |
+0.8% |
| May |
260.08 |
+1.0% |
+1.1% |
| June |
261.90 |
+0.7% |
+1.3% |
| July |
263.66 |
+0.7% |
+2.0% |
| Aug |
263.23 |
-0.2% |
+2.3% |
| Sep |
263.26 |
0% |
+2.8% |
| Oct |
262.56 |
-0.2% |
+2.7% |
| Nov |
263.18 |
+0.2% |
+3.9% |
| Dec |
263.51 |
+0.1% |
+4.7% |
| Jan ’20 |
264.04 |
+0.2% |
+5.1% |
| Feb |
265.34 |
+0.5% |
+4.6% |
| Mar |
269.63 |
+1.6% |
+5.2% |
| Apr |
272.48 |
+1.1% |
+5.8% |
| May |
273.51 |
+0.4% |
+5.2% |
From cnbc:
Nationally, prices rose 4.5% annually in May, according to the S&P CoreLogic Case-Shiller U.S. National Home Price Index. That is down from the 4.6% gain in April.
Home prices in the 10-city composite increased 3.1% annually, down from 3.3% in the previous month. The 20-city composite rose 3.7% year over year, down from 3.9% in April (Detroit was excluded from the composite due to data collection issues).
“More data will obviously be required in order to know whether May’s report represents a reversal of the previous path of accelerating prices or merely a slight deviation from an otherwise intact trend,” said Craig Lazzara, managing director and global head of index investment strategy at S&P Dow Jones Indices. “Even if prices continue to decelerate, that is quite different from an environment in which prices actually decline.”
Home values increased in all 19 of the cities for which data was available, but the gains accelerated in just three. Prices were accelerating in 12 cities in April and 18 cities in March.
Regionally, price gains in Phoenix, Seattle and Tampa continued to be the strongest in the nation. Phoenix posted a 9% year-over-year price increase, followed by Seattle with a 6.8% increase and Tampa with a 6% increase. Price gains were smallest in Chicago, New York and San Francisco.
Link to Article
by Jim the Realtor | Jun 30, 2020 | Jim's Take on the Market, Same-House Sales |
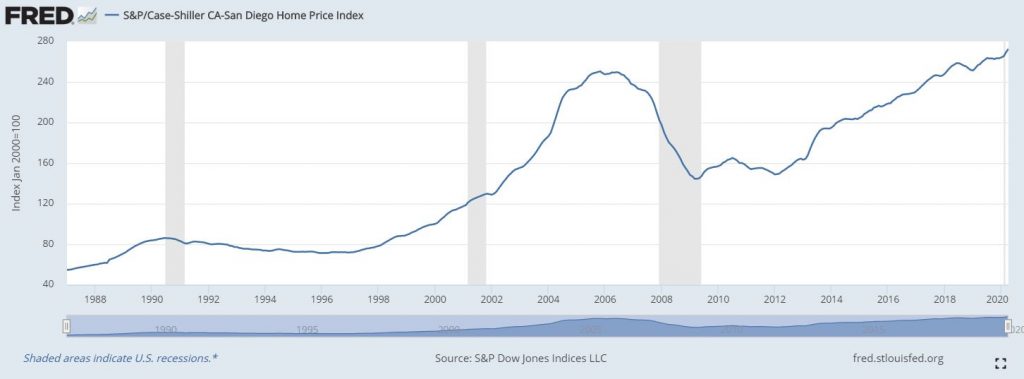
The local Case-Shiller Index for April rose again, which makes you wonder how big the 2020 selling season could have been without the ‘rona – though if more sellers would have listed their home for sale, and rates were higher, the price increases probably wouldn’t have been so pronounced. Buyers can’t get a break!
San Diego Non-Seasonally-Adjusted CSI changes:
| Observation Month |
SD CSI |
M-o-M chg |
Y-o-Y chg |
| January ’18 |
248.16 |
+0.8% |
+7.3% |
| Feb |
250.91 |
+1.1% |
+7.5% |
| Mar |
253.41 |
+1.0% |
+7.6% |
| April |
255.63 |
+0.9% |
+7.7% |
| May |
257.07 |
+0.6% |
+7.3% |
| Jun |
258.44 |
+0.6% |
+6.9% |
| Jul |
258.49 |
0.0% |
+6.2% |
| Aug |
257.32 |
-0.5% |
+4.7% |
| Sept |
256.13 |
-0.4% |
+3.9% |
| Oct |
255.26 |
-0.1% |
+3.7% |
| Nov |
253.37 |
-0.6% |
+3.3% |
| Dec |
251.68 |
-0.7% |
+2.3% |
| January ’19 |
251.30 |
-0.2% |
+1.3% |
| Feb |
253.69 |
+0.9% |
+1.1% |
| Mar |
256.40 |
+1.1% |
+1.2% |
| Apr |
257.63 |
+0.5% |
+0.8% |
| May |
260.08 |
+1.0% |
+1.1% |
| June |
261.90 |
+0.7% |
+1.3% |
| July |
263.66 |
+0.7% |
+2.0% |
| Aug |
263.23 |
-0.2% |
+2.3% |
| Sep |
263.26 |
0% |
+2.8% |
| Oct |
262.56 |
-0.2% |
+2.7% |
| Nov |
263.18 |
+0.2% |
+3.9% |
| Dec |
263.51 |
+0.1% |
+4.7% |
| Jan ’20 |
264.04 |
+0.2% |
+5.1% |
| Feb |
265.34 |
+0.5% |
+4.6% |
| Mar |
269.63 |
+1.6% |
+5.2% |
| Apr |
272.48 |
+1.1% |
+5.8% |
From cnbc.com:
Home prices strengthened in April, despite a national economic shutdown and a sharp drop in home sales due to the coronavirus.
Prices for existing homes rose 4.7% compared with April 2019, and up from 4.6% in the previous month, according to the S&P CoreLogic Case-Shiller National Home Price Index. Price gains have been accelerating since autumn.
The 10-City Composite rose 3.4% annually, which was unchanged from March. The 20-City Composite increased 4% year over year, up from 3.9% in the previous month. Detroit continues to be excluded from 20-City Composite due to price reporting issues caused by the pandemic.
Cities with the strongest annual price gains were Phoenix, Seattle and Minneapolis. They reported increases of 8.8%, 7.3% and 6.4% respectively. Twelve of the 19 cities reported higher price increases in the year ending April 2020 versus the year ending March 2020.
“April’s housing price data continue to be remarkably stable,” said Craig J. Lazzara, managing director and global head of index investment strategy at S&P Dow Jones Indices. “The price trend that was in place pre-pandemic seems so far to be undisturbed, at least at the national level.”
Record low mortgage rates have been giving buyers more purchasing power, thereby helping to keep prices strong. The average rate on the popular 30-year fixed mortgage, however, did jump briefly in March, which would have factored into April closed sales. Rates have since pulled back.
Sales of existing homes dropped to the slowest pace in a decade in April, according to the National Association of Realtors, as open houses were shuttered and the entire house hunting process went online. Not only did buyers pull back, but sellers either waited to list their homes or those already on the market pulled their listings.
But home sales have rebounded quickly and dramatically, with signed contracts on existing homes in May making the strongest monthly jump since the Realtors began tracking the metric in 2001. The supply of homes for sale continues drop, even as new listings now come on the market. Demand is incredibly strong, suggesting that prices will only get hotter in the coming months.
“As states and businesses continue expanding activity, homebuyers are showing increasing interest in purchasing homes, particularly those looking to take advantage of enticingly low mortgage rates,” said George Ratiu, senior economist at realtor.com. “However, extremely scarce inventory, tight mortgage underwriting and high unemployment continue to be the main challenges for many buyers. The latest weekly housing data shows national inventory is on a steep downward trend.”


