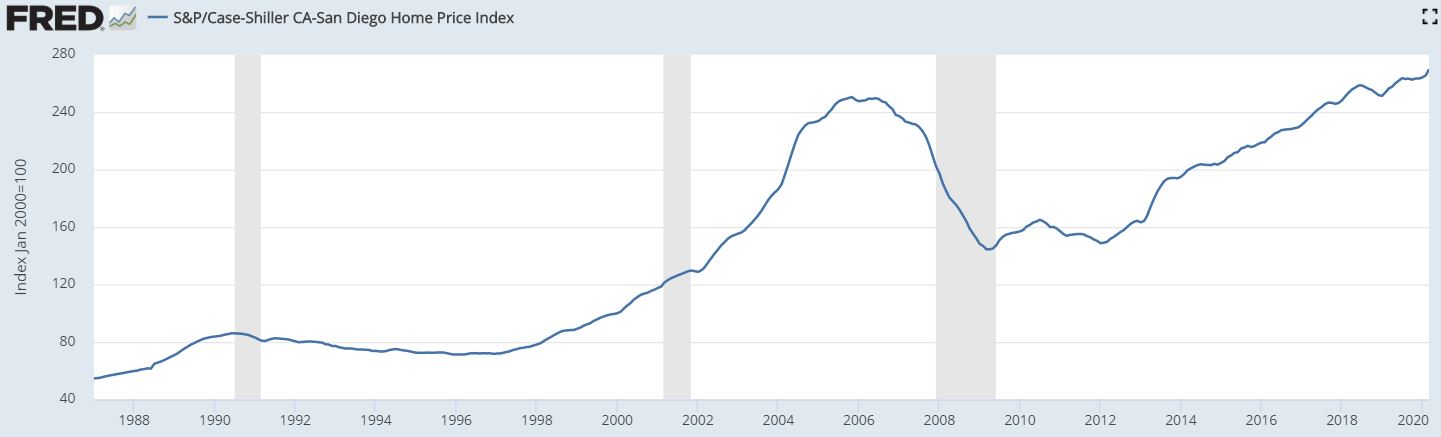
The local Case-Shiller Index for March had the biggest monthly increase in 2+ years, and helps to show why we are getting back to a healthy market quickly. March is usually a strong month though:
San Diego Non-Seasonally-Adjusted CSI changes:
Observation Month
SD CSI
M-o-M chg
Y-o-Y chg
January ’18
248.16
+0.8%
+7.3%
Feb
250.91
+1.1%
+7.5%
Mar
253.41
+1.0%
+7.6%
April
255.63
+0.9%
+7.7%
May
257.07
+0.6%
+7.3%
Jun
258.44
+0.6%
+6.9%
Jul
258.49
0.0%
+6.2%
Aug
257.32
-0.5%
+4.7%
Sept
256.13
-0.4%
+3.9%
Oct
255.26
-0.1%
+3.7%
Nov
253.37
-0.6%
+3.3%
Dec
251.68
-0.7%
+2.3%
January ’19
251.30
-0.2%
+1.3%
Feb
253.69
+0.9%
+1.1%
Mar
256.40
+1.1%
+1.2%
Apr
257.63
+0.5%
+0.8%
May
260.08
+1.0%
+1.1%
June
261.90
+0.7%
+1.3%
July
263.66
+0.7%
+2.0%
Aug
263.23
-0.2%
+2.3%
Sep
263.26
0%
+2.8%
Oct
262.56
-0.2%
+2.7%
Nov
263.18
+0.2%
+3.9%
Dec
263.51
+0.1%
+4.7%
Jan ’20
264.04
+0.2%
+5.1%
Feb
265.34
+0.5%
+4.6%
Mar
269.63
+1.6%
+5.2%
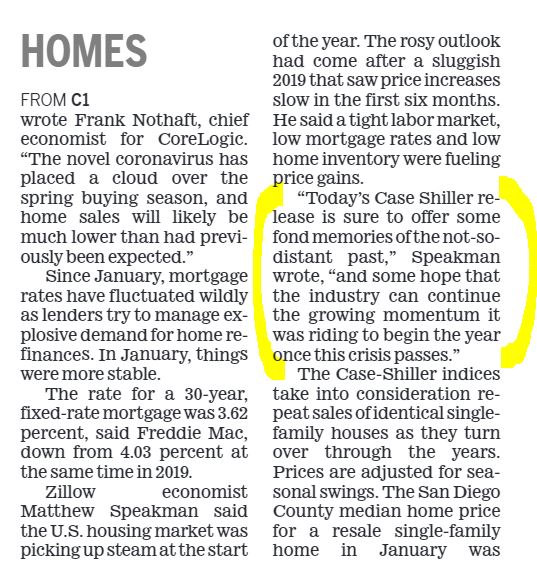
From cnbc:
The strength in March prices came even as mortgage rates bumped sharply higher during the month. That should have given homebuyers less purchasing power. Rates began falling precipitously after that and hit a new record low late this month.
“As states are cautiously reopening business activity and people are looking at summer plans in a new light, the reality of 25 million unemployed Americans is casting looming clouds over the horizon,” said George Ratiu, senior economist at realtor.com.” For homebuyers, low availability coupled with still-rising prices are overshadowing the benefit of historically low mortgage rates.”
The March numbers should be taken with a grain of salt since they are 2 months old and are calculated using a three-month running average.
“Housing prices have not yet registered any adverse effects from the governmental suppression of economic activity in response to the COVID-19 pandemic,” Lazzara said. “As much of the U.S. economy remained shuttered in April, next month’s data may show a more noticeable impact.”
This year’s month-over-month gain in San Diego is about half of what it was in February 2018 & 2019.
“The big question now, is how quickly the home listings will awaken after the pause or will unemployment drag down purchase activity going forward. If buyers come back faster than sellers, it could cause prices to push even higher as buyers compete over the slim choices.”
Bill Banfield, Quicken Loans Executive Vice President of Capital Markets
San Diego Non-Seasonally-Adjusted CSI changes:
Observation Month
SD CSI
M-o-M chg
Y-o-Y chg
January ’18
248.16
+0.8%
+7.3%
Feb
250.91
+1.1%
+7.5%
Mar
253.41
+1.0%
+7.6%
April
255.63
+0.9%
+7.7%
May
257.07
+0.6%
+7.3%
Jun
258.44
+0.6%
+6.9%
Jul
258.49
0.0%
+6.2%
Aug
257.32
-0.5%
+4.7%
Sept
256.13
-0.4%
+3.9%
Oct
255.26
-0.1%
+3.7%
Nov
253.37
-0.6%
+3.3%
Dec
251.68
-0.7%
+2.3%
January ’19
251.30
-0.2%
+1.3%
Feb
253.69
+0.9%
+1.1%
Mar
256.40
+1.1%
+1.2%
Apr
257.63
+0.5%
+0.8%
May
260.08
+1.0%
+1.1%
June
261.90
+0.7%
+1.3%
July
263.66
+0.7%
+2.0%
Aug
263.23
-0.2%
+2.3%
Sep
263.26
0%
+2.8%
Oct
262.56
-0.2%
+2.7%
Nov
263.18
+0.2%
+3.9%
Dec
263.51
+0.1%
+4.7%
Jan ’20
264.04
+0.2%
+5.1%
Feb
265.34
+0.5%
+4.6%
“Results for the month were broad-based, with gains in every city in our 20-City Composite; 17 of the 20 cities saw accelerating prices,” said Craig Lazzara, managing director and global head of index investment strategy at S&P Dow Jones Indices.
Price gains continued to be strongest in Phoenix, Seattle, Tampa and Charlotte. In February, Phoenix home values were up 7.5% year over year, followed by Seattle with a 6% increase, and Tampa and Charlotte with 5.2% increases. Chicago, New York and Dallas saw the smallest annual price gains at 0.7%, 1.5% and 2.5% respectively.
My guess is that NSDCC sales will drop by at least 60% in 2Q20, and our price gauges fall 5% – sellers won’t tolerate any more than that, and they will wait it out instead.
“As has been the case since mid-2019, after a long period of decelerating price increases, the National, 10-City, and 20-City Composites all rose at a faster rate in January than they had done in December,” Craig J. Lazzara, managing director and global head of Index Investment Strategy at S&P Dow Jones Indices, wrote in a release. “Housing prices were particularly strong in the West and South, and comparatively weak in the Midwest and Northeast.”
Lazzara did make a point to note that all of this data is pre-coronavirus impacts and does not reflect any of the slowdown in both the economy and the housing market. While he did not make any predictions, others say home prices could fall nationally for the first time since the recession.
“We expect a peak-to-trough fall in prices of around 4% by early 2021, with values then flattening out for the rest of the year,” wrote Matthew Pointon, an economist with Capital Economics. “Housing demand will see a sharp decline as unemployment hits record highs, and households are prevented from buying a home due to the shut down of large parts of the economy.”
Pointon says the risk to housing will rise, so buyers’ willingness to pay for a home will fall, and house price expectations will take a hit.
The 4.7% increase year-over-year only looks that impressive because of the 6-month decline we experienced at the end of 2018. The index has been flat since July.
Comparing to the dreadful end of 2018 doesn’t tell us much, but at least we had a positive move between October and November – we’re almost back to where we were in September!
San Diego Non-Seasonally-Adjusted CSI changes:
Observation Month
SD CSI
M-o-M chg
Y-o-Y chg
January ’18
248.16
+0.8%
+7.3%
February
250.91
+1.1%
+7.5%
March
253.41
+1.0%
+7.6%
April
255.63
+0.9%
+7.7%
May
257.07
+0.6%
+7.3%
Jun
258.44
+0.6%
+6.9%
Jul
258.49
0.0%
+6.2%
Aug
257.32
-0.5%
+4.7%
Sept
256.13
-0.4%
+3.9%
Oct
255.26
-0.1%
+3.7%
Nov
253.37
-0.6%
+3.3%
Dec
251.68
-0.7%
+2.3%
January ’19
251.30
-0.2%
+1.3%
Feb
253.69
+0.9%
+1.1%
Mar
256.40
+1.1%
+1.2%
Apr
257.63
+0.5%
+0.8%
May
260.08
+1.0%
+1.1%
June
261.90
+0.7%
+1.3%
July
263.66
+0.7%
+2.0%
Aug
263.23
-0.2%
+2.3%
Sep
263.26
0%
+2.8%
Oct
262.56
-0.2%
+2.7%
Nov
263.18
+0.2%
+3.9%
There were times that our index was going up 1% per month, and now it’s around +1% per quarter which is a good pace for buyers – it’s not going up fast enough for them to feel they need to grab something quickly.
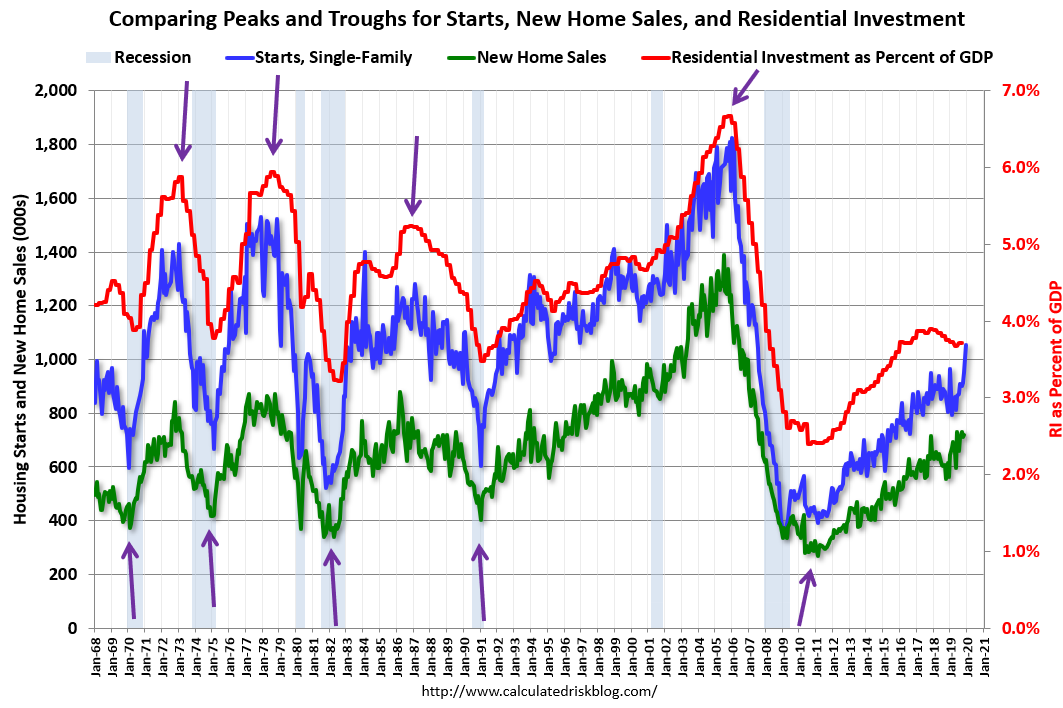
Since this post (in July, 2018), existing home sales have mostly moved sideways, and both new home sales and single family starts have hit new cycle highs.
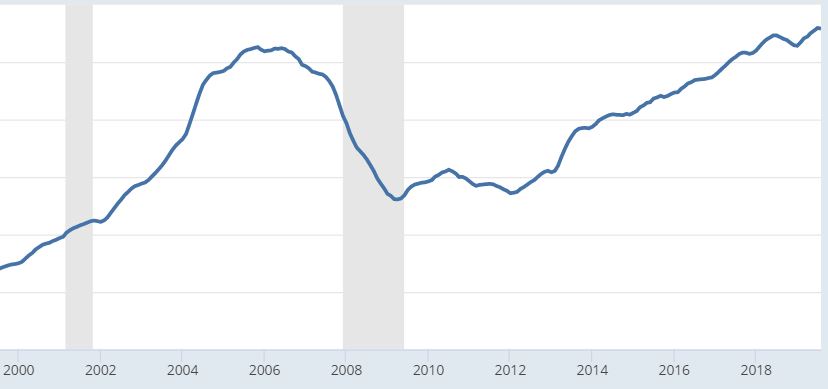
Here is the graph I like to use to track tops and bottoms for housing activity. This is a graph of Single family housing starts, New Home Sales, and Residential Investment (RI) as a percent of GDP.
The arrows point to some of the earlier peaks and troughs for these three measures.
The purpose of this graph is to show that these three indicators generally reach peaks and troughs together. Note that Residential Investment is quarterly and single-family starts and new home sales are monthly.
RI as a percent of GDP has been sluggish recently, mostly due to softness in multi-family residential. However, both single family starts and new home sales have set new cycle highs this year.
Also, look at the relatively low level of RI as a percent of GDP, new home sales and single family starts compared to previous peaks.
To have a significant downturn from these levels would be surprising.
Our index stayed flat, which is better than last year!
San Diego Non-Seasonally-Adjusted CSI changes:
Observation Month
SD CSI
M-o-M chg
Y-o-Y chg
January ’18
248.16
+0.8%
+7.3%
February
250.91
+1.1%
+7.5%
March
253.41
+1.0%
+7.6%
April
255.63
+0.9%
+7.7%
May
257.07
+0.6%
+7.3%
Jun
258.44
+0.6%
+6.9%
Jul
258.49
0.0%
+6.2%
Aug
257.32
-0.5%
+4.7%
Sept
256.13
-0.4%
+3.9%
Oct
255.26
-0.1%
+3.7%
Nov
253.37
-0.6%
+3.3%
Dec
251.68
-0.7%
+2.3%
January ’19
251.30
-0.2%
+1.3%
Feb
253.69
+0.9%
+1.1%
Mar
256.40
+1.1%
+1.2%
Apr
257.63
+0.5%
+0.8%
May
260.08
+1.0%
+1.1%
June
261.90
+0.7%
+1.3%
July
263.66
+0.7%
+2.0%
Aug
263.23
-0.2%
+2.3%
Sep
263.26
0%
+2.8%
Will we have a slight descent for the next few months, and send our index back into the 250s? If so, 2020 will probably look a lot like 2018 and 2019, price-wise.
Mortgage rates have been 1% lower than they were a year ago, yet sales are flat….and so are prices. We had a 2.3% improvement year-over-year, which is actually the best percentage improvement in 2019. But look at how our Y-o-Y changes have pancaked this year, compared to 2018:
San Diego Non-Seasonally-Adjusted CSI changes:
Observation Month
SD CSI
M-o-M chg
Y-o-Y chg
January ’18
248.16
+0.8%
+7.3%
February
250.91
+1.1%
+7.5%
March
253.41
+1.0%
+7.6%
April
255.63
+0.9%
+7.7%
May
257.07
+0.6%
+7.3%
Jun
258.44
+0.6%
+6.9%
Jul
258.49
0.0%
+6.2%
Aug
257.32
-0.5%
+4.7%
Sept
256.13
-0.4%
+3.9%
Oct
255.26
-0.1%
+3.7%
Nov
253.37
-0.6%
+3.3%
Dec
251.68
-0.7%
+2.3%
January ’19
251.30
-0.2%
+1.3%
Feb
253.69
+0.9%
+1.1%
Mar
256.40
+1.1%
+1.2%
Apr
257.63
+0.5%
+0.8%
May
260.08
+1.0%
+1.1%
June
261.90
+0.7%
+1.3%
July
263.66
+0.7%
+2.0%
Aug
263.23
-0.2%
+2.3%
This latest month-over-month reading did go negative again, just like it did in August of last year. Will we have six consecutive months of negative readings in 2019, and send our index back into the 250s? If so, 2020 will probably look a lot like 2018 and 2019, price-wise.