by Jim the Realtor | Sep 24, 2019 | Jim's Take on the Market, Market Conditions, Same-House Sales
Yesterday, Yunnie said that he sees no sign of buyer optimism fading, to which I said ‘just wait for the Case-Shiller Index (which should be the strongest of the year)’.
CNBC posted the click bait above, which is shocking because they are usually so negative about real estate – then published the key points below:
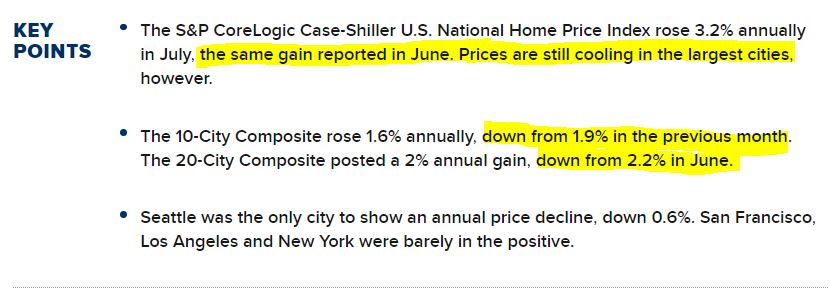
Mortgage rates dropped back into the threes at the end of May, yet the national index didn’t change between June and July? Every other time buyers could get a mortgage rate that started with a 3, they’ve come running. But not this time – home prices are stalled year-over-year, and existing home sales in the West declined 3.4% in August.
But never fear, our head cheerleader won’t let that get in the way:
Lawrence Yun, NAR’s chief economist said, “As expected, buyers are finding it hard to resist the current rates,” he said. “The desire to take advantage of these promising conditions is leading more buyers to the market.”
What he should say is that sellers should be sharpening their price. You’re on our side Yunnie, help us out!
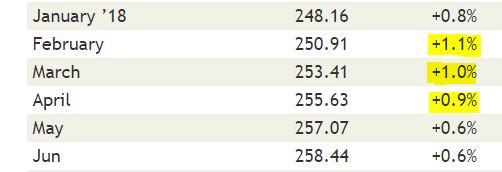
San Diego Non-Seasonally-Adjusted CSI changes:
| Observation Month |
SD CSI |
M-o-M chg |
Y-o-Y chg |
| January ’18 |
248.16 |
+0.8% |
+7.3% |
| February |
250.91 |
+1.1% |
+7.5% |
| March |
253.41 |
+1.0% |
+7.6% |
| April |
255.63 |
+0.9% |
+7.7% |
| May |
257.07 |
+0.6% |
+7.3% |
| Jun |
258.44 |
+0.6% |
+6.9% |
| Jul |
258.49 |
0.0% |
+6.2% |
| Aug |
257.32 |
-0.5% |
+4.7% |
| Sept |
256.13 |
-0.4% |
+3.9% |
| Oct |
255.26 |
-0.1% |
+3.7% |
| Nov |
253.37 |
-0.6% |
+3.3% |
| Dec |
251.68 |
-0.7% |
+2.3% |
| January ’19 |
251.30 |
-0.2% |
+1.3% |
| Feb |
253.69 |
+0.9% |
+1.1% |
| Mar |
256.40 |
+1.1% |
+1.2% |
| Apr |
257.63 |
+0.5% |
+0.8% |
| May |
260.01 |
+1.0% |
+1.1% |
| June |
261.77 |
+0.7% |
+1.3% |
| July |
263.58 |
+0.7% |
+2.0% |
The index is a three-month weighted average, so July closings should reflect the environment where mortgage rates were 3-something for the buyers. But they aren’t willing to pay 1% more than in June?
Looks like a sign of buyer optimism fading to me.
by Jim the Realtor | Aug 28, 2019 | Bubble Talk, Jim's Take on the Market, Same-House Sales |
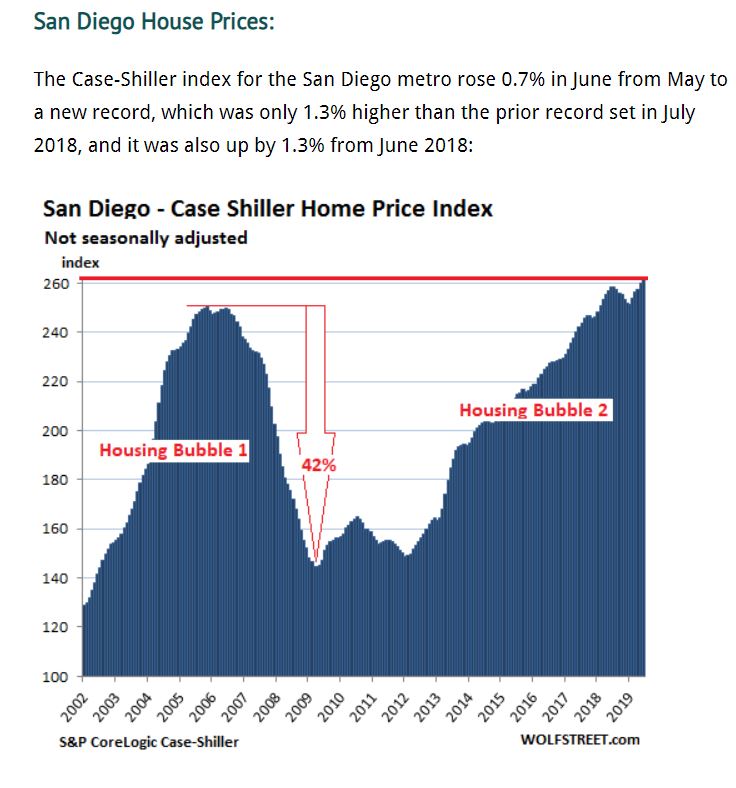
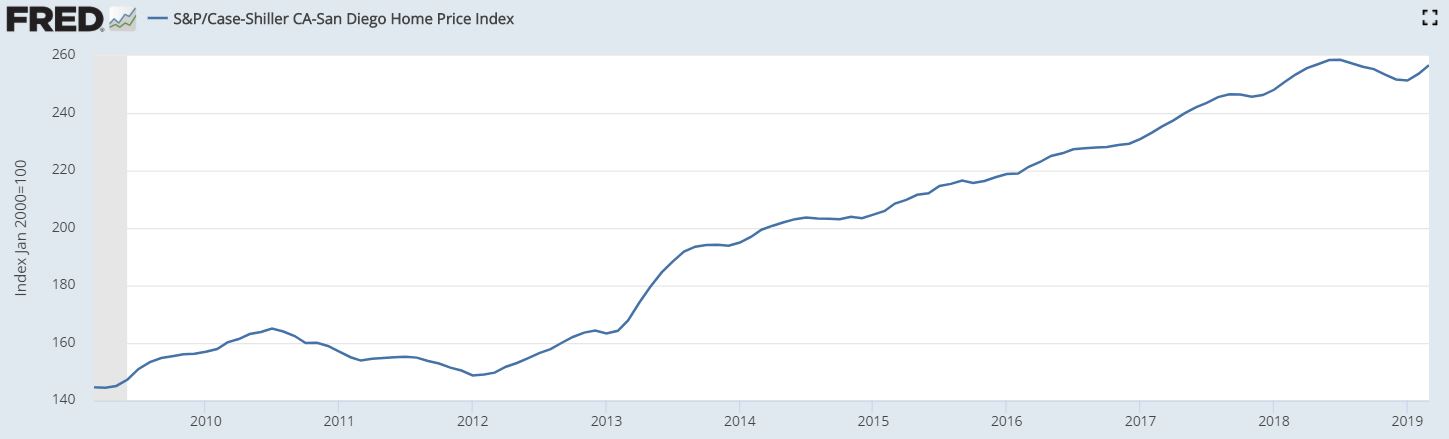
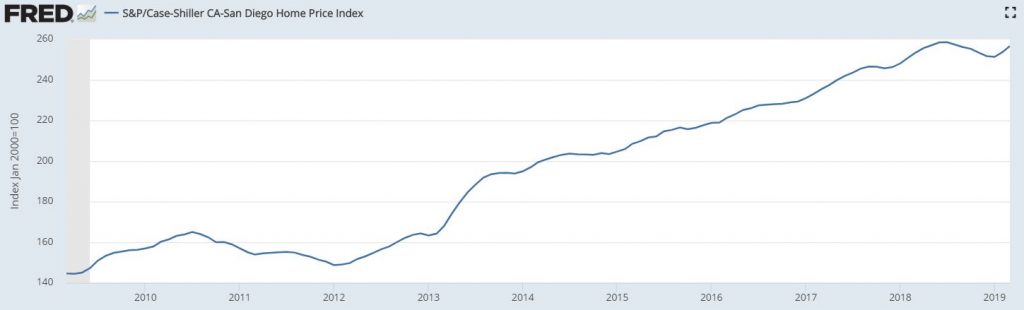
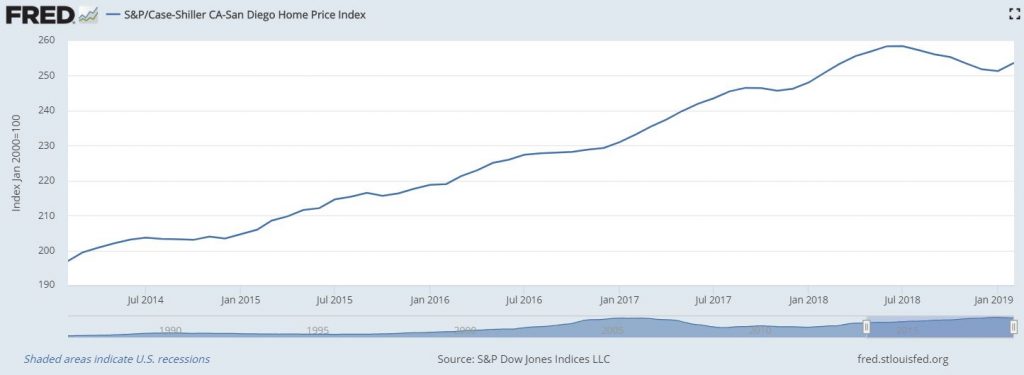
Our Case-Shiller Index did set a new record yesterday, but our Housing Bubble 2 is relatively tame – just 4% above the previous peak of 250.34 in November, 2005.
Compare to others like Seattle (+33% over last peak), San Francisco (+41%), and Denver (+59%) here:
https://wolfstreet.com/2019/08/27/the-most-splendid-house-price-bubbles-in-america-august-update-western-markets-see-the-dip/
by Jim the Realtor | Jul 30, 2019 | Jim's Take on the Market, Same-House Sales |
We had a solid 1% increase in our local index M-o-M, and it was about the same year-over-year:
San Diego Non-Seasonally-Adjusted CSI changes:
| Observation Month |
SD CSI |
M-o-M chg |
Y-o-Y chg |
| January ’18 |
248.16 |
+0.8% |
+7.3% |
| February |
250.91 |
+1.1% |
+7.5% |
| March |
253.41 |
+1.0% |
+7.6% |
| April |
255.63 |
+0.9% |
+7.7% |
| May |
257.07 |
+0.6% |
+7.3% |
| Jun |
258.44 |
+0.6% |
+6.9% |
| Jul |
258.49 |
0.0% |
+6.2% |
| Aug |
257.32 |
-0.5% |
+4.7% |
| Sept |
256.13 |
-0.4% |
+3.9% |
| Oct |
255.26 |
-0.1% |
+3.7% |
| Nov |
253.37 |
-0.6% |
+3.3% |
| Dec |
251.68 |
-0.7% |
+2.3% |
| January ’19 |
251.30 |
-0.2% |
+1.3% |
| Feb |
253.69 |
+0.9% |
+1.1% |
| Mar |
256.44 |
+1.1% |
+1.2% |
| Apr |
257.63 |
+0.5% |
+0.8% |
| May |
260.17 |
+1.0% |
+1.2% |
From cnbc on today’s Pending-Home-Sales increase of 2.8% nationally:
“If mortgage rates remain near recent lows, we could see prices pick back up as a result of improved affordability as well as the possibility of more limited inventory available,” said Danielle Hale, chief economist for Realtor.com.
The supply of homes for sale had been rising for much of this year but flattened in June. Some are predicting inventory will be lower again this fall. That is causing more competition in the market.
“Homes are selling at a breakneck pace, in less than a month, on average, for existing homes and three months for newly constructed homes,” said Yun. “Homeowners’ equity in real estate has doubled over the past six years to now nearly $16 trillion. But the number of potential buyers exceeds the number of homes available. We need to see sizable growth in inventory, particularly of entry-level homes, to assure wider access to homeownership.”
Regionally, the Realtors’ pending home sales index rose 2.7% in the Northeast month-to-month and was 0.9% higher than a year ago. In the Midwest, the index grew 3.3% monthly and 1.7% annually. In the South, the index increased 1.3% monthly and 1.4% annually. In the West, pending sales jumped 5.4% monthly and were 2.5% higher than a year ago.
by Jim the Realtor | Jun 25, 2019 | Jim's Take on the Market, Same-House Sales |
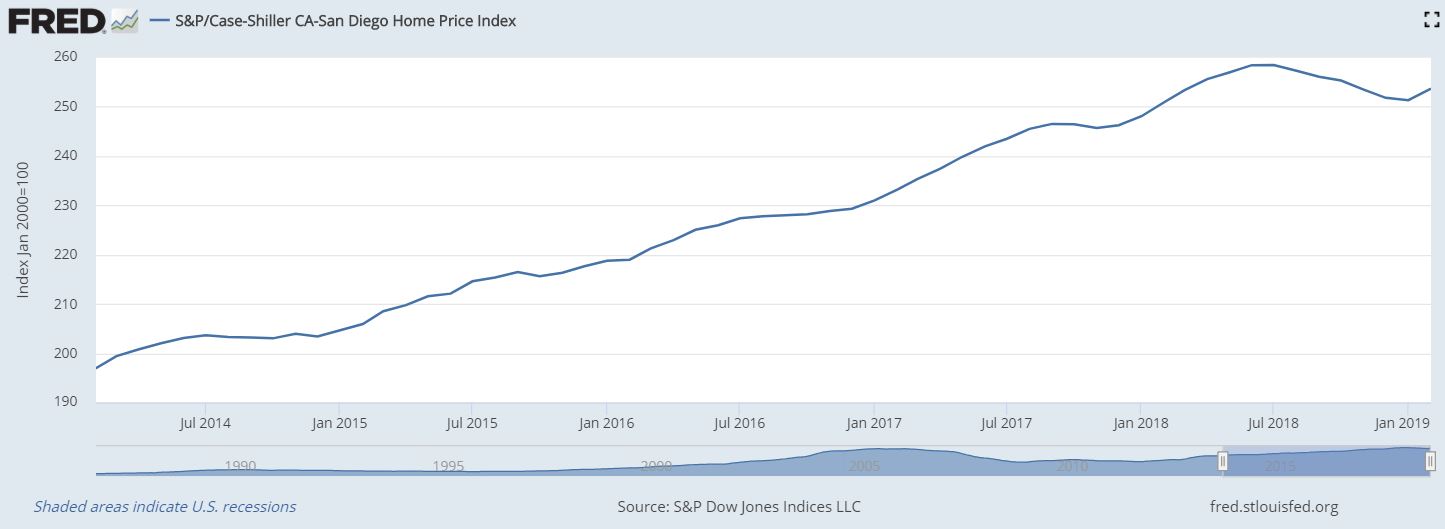
Yesterday’s Zillow index showed San Diego’s pricing to be fairly flat, and now April’s Case-Shiller Index has a similar-sounding +0.8% increase year-over-year.
We’ve bounced back from six months of negative readings, just to get back to where we were last year – and we’re still not as high as the June and July 2018 readings:
San Diego Non-Seasonally-Adjusted CSI changes:
| Observation Month |
SD CSI |
M-o-M chg |
Y-o-Y chg |
| January ’18 |
248.16 |
+0.8% |
+7.3% |
| February |
250.91 |
+1.1% |
+7.5% |
| March |
253.41 |
+1.0% |
+7.6% |
| April |
255.63 |
+0.9% |
+7.7% |
| May |
257.07 |
+0.6% |
+7.3% |
| Jun |
258.44 |
+0.6% |
+6.9% |
| Jul |
258.49 |
0.0% |
+6.2% |
| Aug |
257.32 |
-0.5% |
+4.7% |
| Sept |
256.13 |
-0.4% |
+3.9% |
| Oct |
255.26 |
-0.1% |
+3.7% |
| Nov |
253.37 |
-0.6% |
+3.3% |
| Dec |
251.68 |
-0.7% |
+2.3% |
| January ’19 |
251.30 |
-0.2% |
+1.3% |
| Feb |
253.66 |
+0.9% |
+1.1% |
| Mar |
256.39 |
+1.2% |
+1.3% |
| Apr |
257.68 |
+0.5% |
+0.8% |
The high-tier index is similar with just a +0.5% increase over last April, and not as high as June, 2018:
From cnbc:
by Jim the Realtor | May 28, 2019 | Jim's Take on the Market, Same-House Sales |
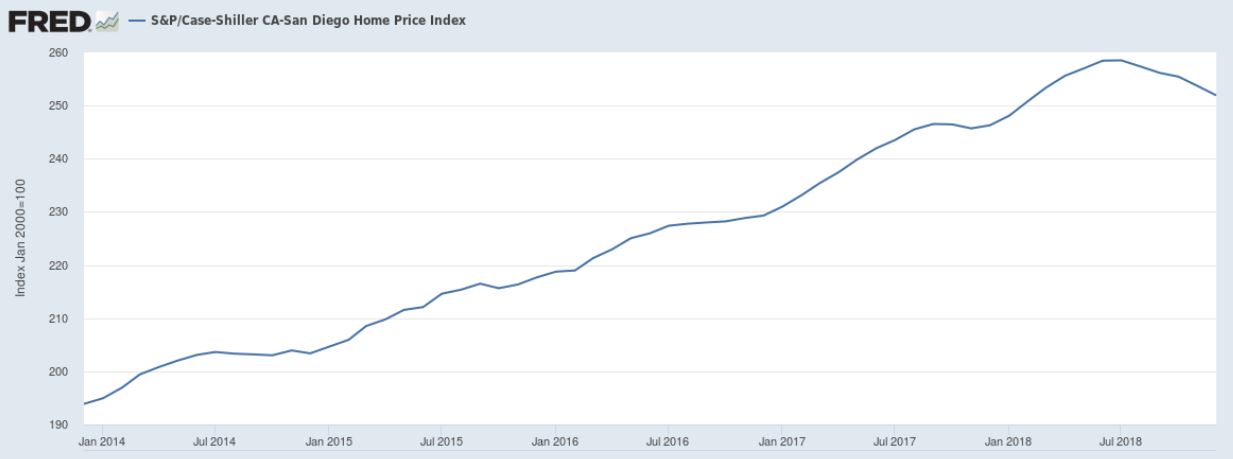
I calculated the monthly increase incorrectly last month – it’s right now, and it shows that the index has picked up steam lately. But we’re still slightly below last year’s peak of 258 in June & July:
San Diego Non-Seasonally-Adjusted CSI changes:
| Observation Month |
SD CSI |
M-o-M chg |
Y-o-Y chg |
| January ’18 |
248.16 |
+0.8% |
+7.3% |
| February |
250.91 |
+1.1% |
+7.5% |
| March |
253.41 |
+1.0% |
+7.6% |
| April |
255.63 |
+0.9% |
+7.7% |
| May |
257.07 |
+0.6% |
+7.3% |
| Jun |
258.44 |
+0.6% |
+6.9% |
| Jul |
258.49 |
0.0% |
+6.2% |
| Aug |
257.32 |
-0.5% |
+4.7% |
| Sept |
256.13 |
-0.4% |
+3.9% |
| Oct |
255.26 |
-0.1% |
+3.7% |
| Nov |
253.37 |
-0.6% |
+3.3% |
| Dec |
251.68 |
-0.7% |
+2.3% |
| January ’19 |
251.30 |
-0.2% |
+1.3% |
| Feb |
253.69 |
+0.9% |
+1.1% |
| Mar |
256.63 |
+1.2% |
+1.3% |
The index is 3.4% higher than it was at the beginning of 2018, but it could be worse.
This NYC broker says homeowners in Manhattan can figure what their home was worth in May, 2018, and then subtract 10% to find today’s value – yikes!
by Jim the Realtor | Apr 30, 2019 | Jim's Take on the Market, Market Buzz, Same-House Sales |
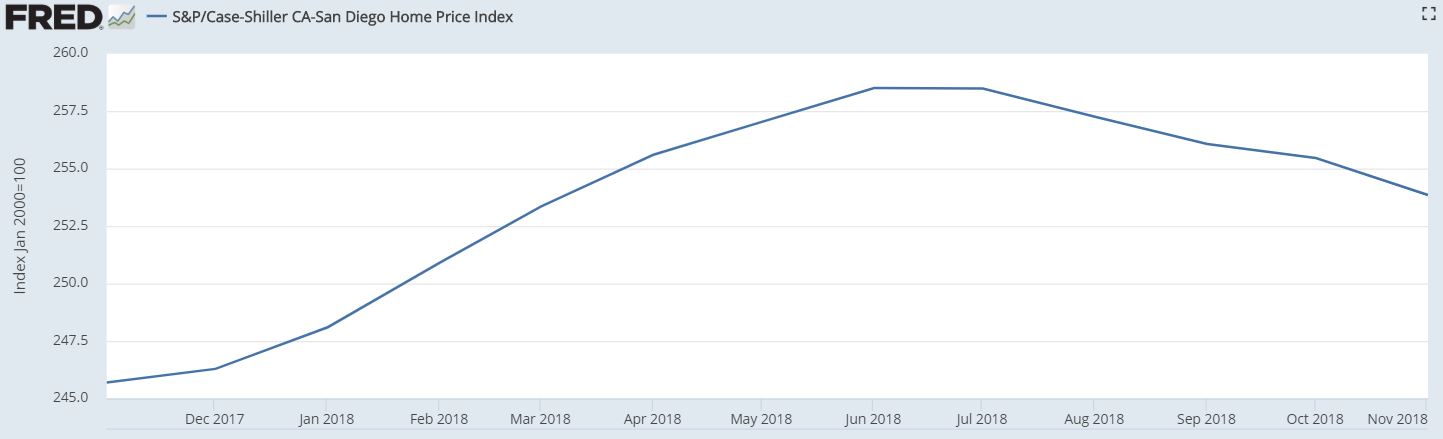
Hey, we had our first monthly increase since June!
Last year the index readings topped out in July, and if that pattern repeats, it will mean that today’s home prices will be the highest of the year.
San Diego Non-Seasonally-Adjusted CSI changes:
| Reporting Month |
SD CSI |
M-o-M chg |
Y-o-Y chg |
| January ’17 |
231.21 |
+0.8% |
+5.7% |
| February |
233.31 |
+0.9% |
+6.5% |
| March |
235.61 |
+1.0% |
+6.4% |
| April |
237.48 |
+0.8% |
+6.6% |
| May |
239.84 |
+1.0% |
+6.5% |
| June |
241.96 |
+0.9% |
+7.0% |
| Jul |
243.48 |
+0.6% |
+7.1% |
| Aug |
245.55 |
+0.9% |
+7.8% |
| Sept |
246.61 |
+0.5% |
+8.2% |
| Oct |
246.58 |
+0.0% |
+8.1% |
| Nov |
245.74 |
-0.3% |
+7.4% |
| Dec |
246.29 |
+0.2% |
+7.4% |
| January ’18 |
248.16 |
+0.8% |
+7.3% |
| February |
250.91 |
+1.1% |
+7.5% |
| March |
253.41 |
+1.0% |
+7.6% |
| April |
255.63 |
+0.9% |
+7.7% |
| May |
257.07 |
+0.6% |
+7.3% |
| Jun |
258.44 |
+0.6% |
+6.9% |
| Jul |
258.49 |
0.0% |
+6.2% |
| Aug |
257.32 |
-0.5% |
+4.7% |
| Sept |
256.13 |
-0.4% |
+3.9% |
| Oct |
255.42 |
-0.1% |
+3.7% |
| Nov |
253.59 |
-0.6% |
+3.3% |
| Dec |
251.92 |
-0.7% |
+2.3% |
| January ’19 |
251.37 |
-0.2% |
+1.3% |
| Feb |
253.70 |
+0.1% |
+1.1% |
Over the last week, we’ve seen soundbites on how home prices declined in Southern California and San Francisco for the first time in seven years, but they are talking about the median sales price – which declined a measly 0.1%. Expect the talking heads to focus on up or down only.
We’re going to be lucky to keep pace with last year’s monthly increases:
Last year the February month-over-month increase was 1.1%, and this year it was only 0.1%. But because the focus is so binary (up or down only), we might escape further scrutiny as long as we can hit a +0.1% each month.
But it’s pretty likely that our local year-over-year readings are going to go negative next month – right as the selling season wraps up. Winter might start early this year!
by Jim the Realtor | Mar 27, 2019 | Jim's Take on the Market, Same-House Sales |
I was so giddy yesterday about dropping rates that the latest Case-Shiller Index didn’t cross my mind. Our doomer guy jumped on the sixth consecutive decline above, but that was when we were nearing 5% mortgage rates and full market stall-out. Now that the sub-4% punch bowl is back, we should see the usual six months of increases begin again with the next reading:
San Diego Non-Seasonally-Adjusted CSI changes:
| Reporting Month |
SD CSI |
M-o-M chg |
Y-o-Y chg |
| January ’17 |
231.21 |
+0.8% |
+5.7% |
| February |
233.31 |
+0.9% |
+6.5% |
| March |
235.61 |
+1.0% |
+6.4% |
| April |
237.48 |
+0.8% |
+6.6% |
| May |
239.84 |
+1.0% |
+6.5% |
| June |
241.96 |
+0.9% |
+7.0% |
| Jul |
243.48 |
+0.6% |
+7.1% |
| Aug |
245.55 |
+0.9% |
+7.8% |
| Sept |
246.61 |
+0.5% |
+8.2% |
| Oct |
246.58 |
+0.0% |
+8.1% |
| Nov |
245.74 |
-0.3% |
+7.4% |
| Dec |
246.29 |
+0.2% |
+7.4% |
| January ’18 |
248.16 |
+0.8% |
+7.3% |
| February |
250.91 |
+1.1% |
+7.5% |
| March |
253.41 |
+1.0% |
+7.6% |
| April |
255.63 |
+0.9% |
+7.7% |
| May |
257.07 |
+0.6% |
+7.3% |
| Jun |
258.44 |
+0.6% |
+6.9% |
| Jul |
258.49 |
0.0% |
+6.2% |
| Aug |
257.32 |
-0.5% |
+4.7% |
| Sept |
256.13 |
-0.4% |
+3.9% |
| Oct |
255.42 |
-0.1% |
+3.7% |
| Nov |
253.59 |
-0.6% |
+3.3% |
| Dec |
251.92 |
-0.7% |
+2.3% |
| Jan |
251.37 |
-0.2% |
+1.3% |
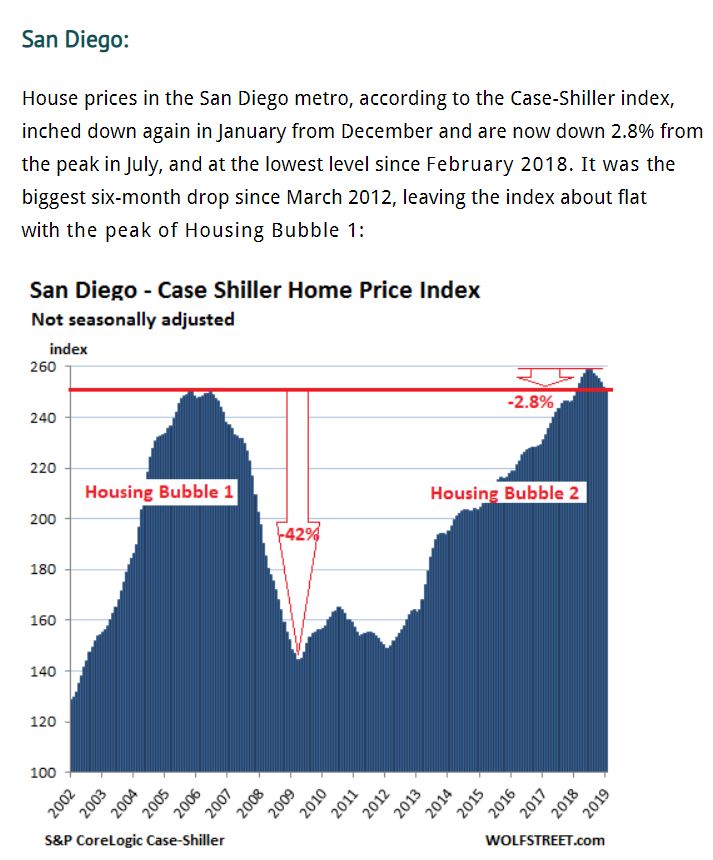
The 2.8% drop over the last six months is nothing but a flesh wound – sellers aren’t going to panic until there are big chunks of decline per month. The previous peak was 250.34 in November, 2005 – about where we are today!
by Jim the Realtor | Feb 26, 2019 | Jim's Take on the Market, Same-House Sales |
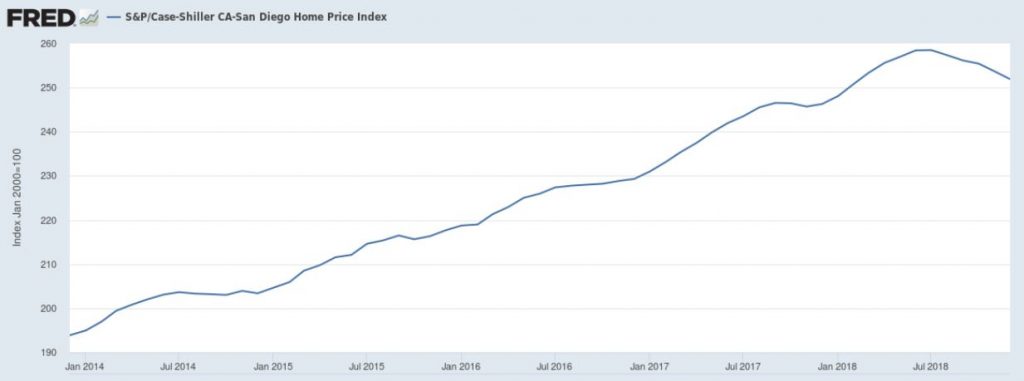
We are back to more-normal appreciation levels now. After dropping for the last six months in a row, the non-seasonally-adjusted Case-Shiller Index for San Diego is just +2.3% year-over-year.
In the graph above, you can see how the index goes up about ten points in the first half of every year, but then pricing tapers off. Last year, the tapering started earlier, and was more pronounced.
It makes you wonder what will happen in 2019? The same? Or worse? It won’t be better unless mortgage rates slip under 4%.
San Diego Non-Seasonally-Adjusted CSI changes:
| Reporting Month |
SD CSI |
M-o-M chg |
Y-o-Y chg |
| January ’17 |
231.21 |
+0.8% |
+5.7% |
| February |
233.31 |
+0.9% |
+6.5% |
| March |
235.61 |
+1.0% |
+6.4% |
| April |
237.48 |
+0.8% |
+6.6% |
| May |
239.84 |
+1.0% |
+6.5% |
| June |
241.96 |
+0.9% |
+7.0% |
| Jul |
243.48 |
+0.6% |
+7.1% |
| Aug |
245.55 |
+0.9% |
+7.8% |
| Sept |
246.61 |
+0.5% |
+8.2% |
| Oct |
246.58 |
+0.0% |
+8.1% |
| Nov |
245.74 |
-0.3% |
+7.4% |
| Dec |
246.29 |
+0.2% |
+7.4% |
| January ’18 |
248.16 |
+0.8% |
+7.3% |
| February |
250.91 |
+1.1% |
+7.5% |
| March |
253.41 |
+1.0% |
+7.6% |
| April |
255.63 |
+0.9% |
+7.7% |
| May |
257.07 |
+0.6% |
+7.3% |
| Jun |
258.48 |
+0.6% |
+6.9% |
| Jul |
258.41 |
0.0% |
+6.2% |
| Aug |
257.25 |
-0.5% |
+4.7% |
| Sept |
256.06 |
-0.4% |
+3.9% |
| Oct |
255.44 |
-0.1% |
+3.7% |
| Nov |
253.67 |
-0.6% |
+3.3% |
| Dec |
251.91 |
-0.7% |
+2.3% |
The previous peak was 250.34 in November, 2005 – about where we are today!
“Slower price appreciation coupled with lower mortgage rates in 2019 should help homebuyers who haven’t been priced out of the market,” said Danielle Hale, chief economist at Realtor.com. “While 2018 started with a real estate frenzy and ended with a fizzle, we could see 2019’s slow beginning start to pick up later in the year.”
by Jim the Realtor | Jan 29, 2019 | Jim's Take on the Market, Same-House Sales
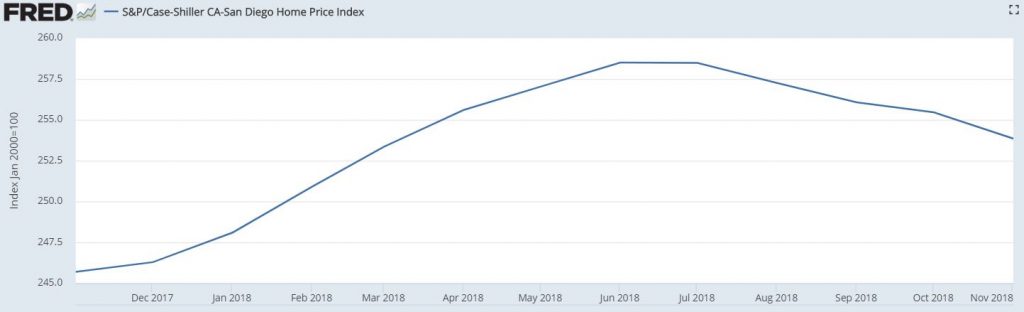
The non-seasonally-adjusted San Diego Case-Shiller Index dropped again in November, which seems like 100 years ago now that we’re rolling into February. A couple of notes:
- If you like your data processed and refined, the seasonally-adjusted index has been flat the last four months. I like mine raw and uncooked.
- They revise these numbers slightly every month.
We are roughly back to where we were in March. You could make the case that the better-quality homes sell for a premium during the selling season while the others wait, and then some of those go for a slight discount in the off-season. It might be the pattern for every year, going forward.
San Diego Non-Seasonally-Adjusted CSI changes:
| Reporting Month |
SD CSI |
M-o-M chg |
Y-o-Y chg |
| January ’17 |
231.21 |
+0.8% |
+5.7% |
| February |
233.31 |
+0.9% |
+6.5% |
| March |
235.61 |
+1.0% |
+6.4% |
| April |
237.48 |
+0.8% |
+6.6% |
| May |
239.84 |
+1.0% |
+6.5% |
| June |
241.96 |
+0.9% |
+7.0% |
| Jul |
243.48 |
+0.6% |
+7.1% |
| Aug |
245.55 |
+0.9% |
+7.8% |
| Sept |
246.61 |
+0.5% |
+8.2% |
| Oct |
246.58 |
+0.0% |
+8.1% |
| Nov |
245.74 |
-0.3% |
+7.4% |
| Dec |
246.29 |
+0.2% |
+7.4% |
| January ’18 |
248.16 |
+0.8% |
+7.3% |
| February |
250.91 |
+1.1% |
+7.5% |
| March |
253.41 |
+1.0% |
+7.6% |
| April |
255.63 |
+0.9% |
+7.7% |
| May |
257.07 |
+0.6% |
+7.3% |
| Jun |
258.48 |
+0.6% |
+6.9% |
| Jul |
258.41 |
0.0% |
+6.2% |
| Aug |
257.25 |
-0.5% |
+4.7% |
| Sept |
256.06 |
-0.4% |
+3.9% |
| Oct |
255.46 |
-0.1% |
+3.7% |
| Nov |
253.85 |
-0.6% |
+3.3% |
The previous peak was 250.34 in November, 2005.
by Jim the Realtor | Jan 17, 2019 | Jim's Take on the Market, Sales and Price Check, Same-House Sales |
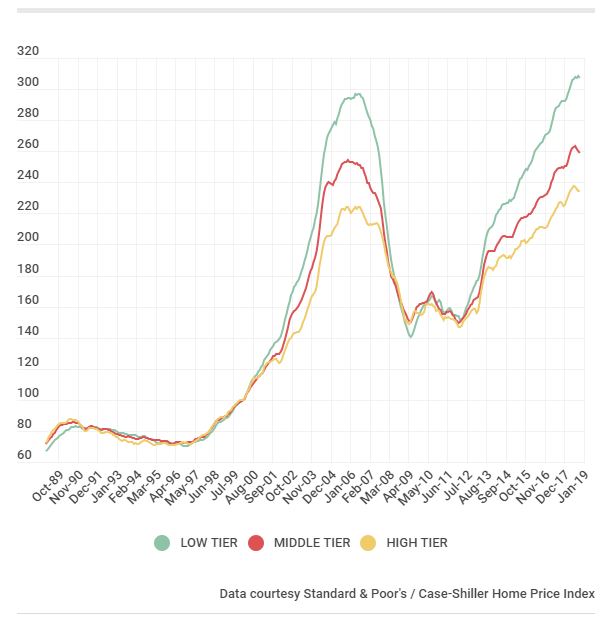
No surprise the trend shows the higher the price, the softer the price increases.
The lower-end market keeps humming along, while the higher-end market isn’t – and the connection between the two is getting fuzzier by the day.
With the struggle of moving up or down being very real, we could see more disconnect between markets.
Let’s keep this in mind when analyzing trends – it’s more complex than ever.
https://journal.firsttuesday.us/san-diego-housing-indicators-2/29246/